
Dashboard Report
How to interpret and configure your Dashboard Report
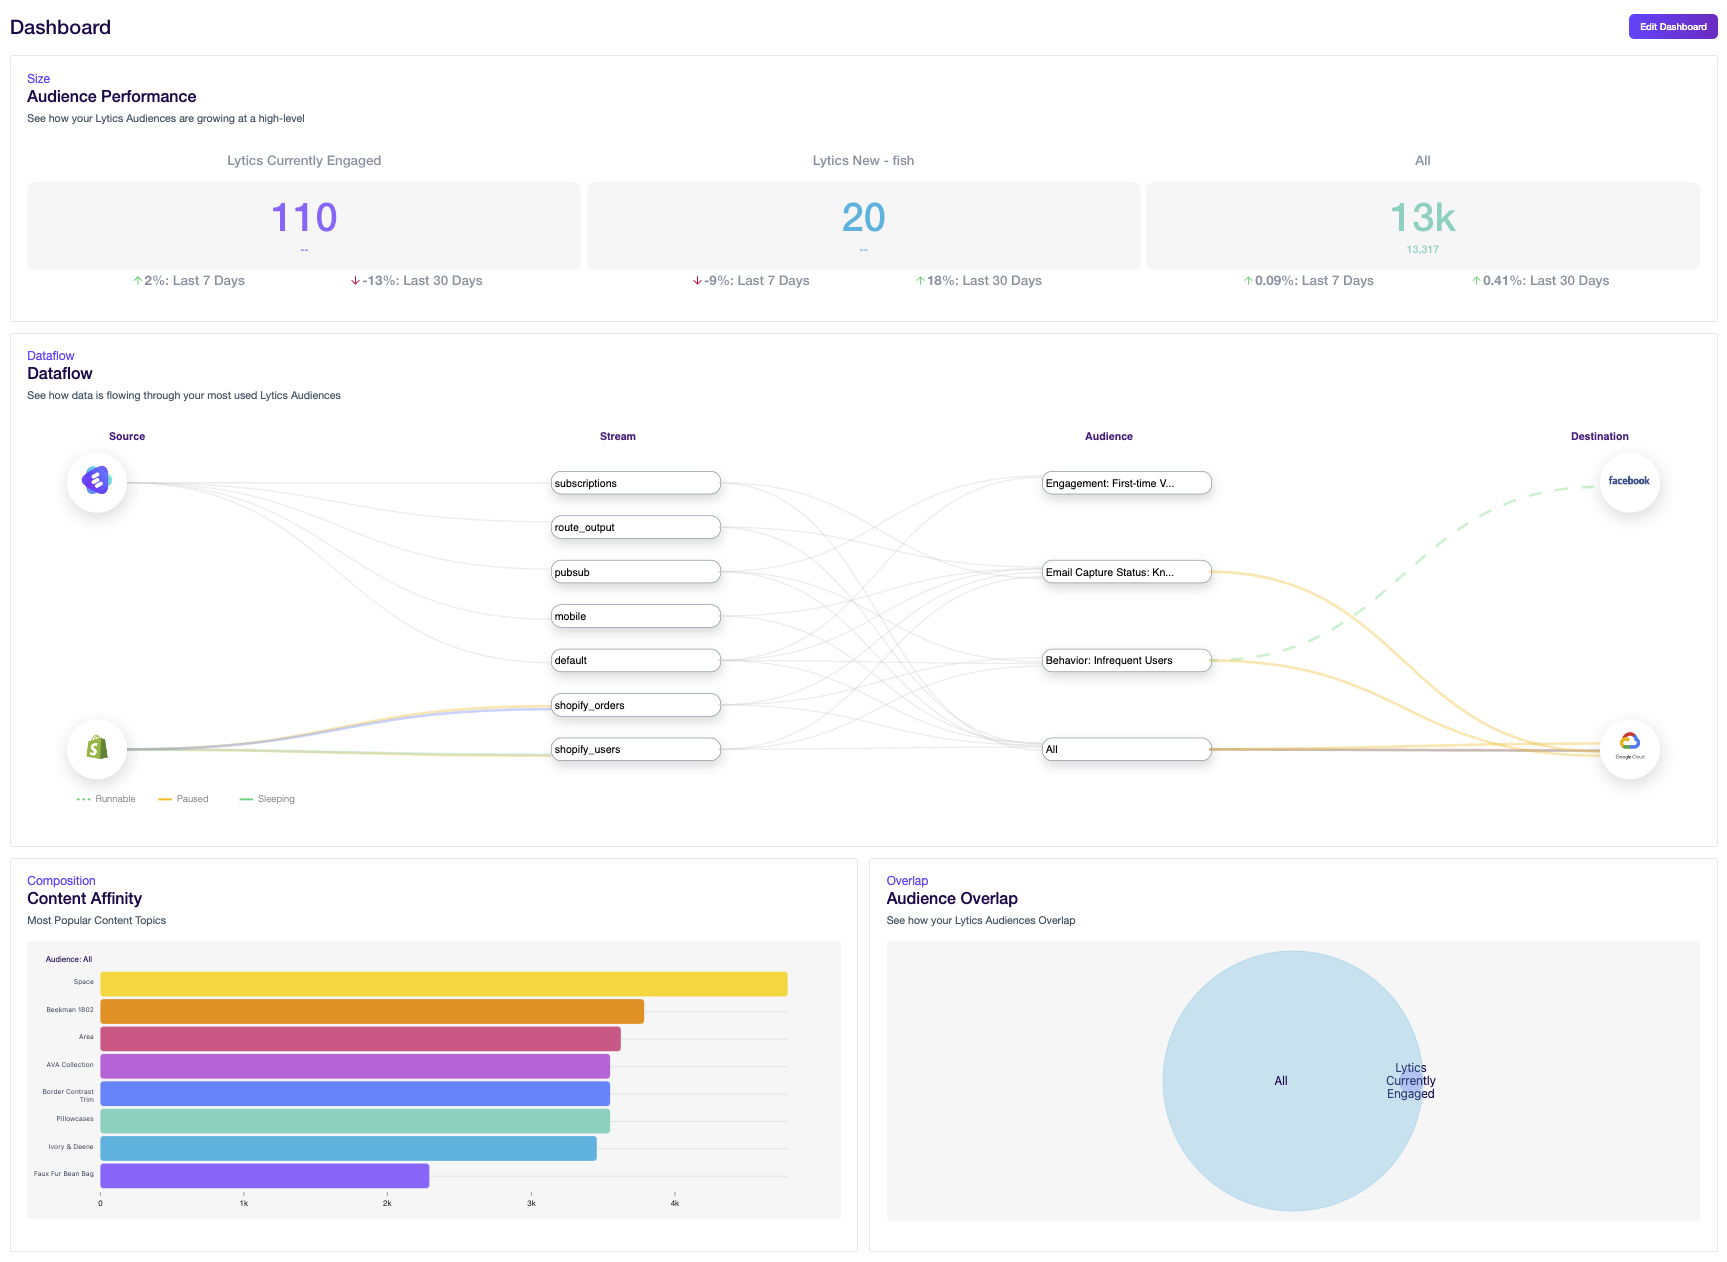
Once data is flowing into your account, Lytics will automatically generate a Dashboard Report on the homepage of the Decision Engine app. While the dashboard Report is fully customizable, the out-of-the-box Report consists of 4 Report Components that incorporate some of Lytics' Behavioral Audiences :
- Size Component of the All, Lytics New, and Lytics Highly Engaged audiences
- Dataflow Component of the 5 most "used" audiences (ie the audiences that appear in the most Jobs).
- Composition Component of Lytics' Content Affinity
- Overlap Component of the All, Lytics New and Lytics Highly Engaged audiences.
To modify or edit the Dashboard Report, simply click on the Edit Dashboard button located on the top-right corner of the page. Clicking this button will redirect you to the Report page, where you can add or delete Components, and edit existing Components.
Updated 9 months ago