

Chrome Extension
Contentstack Data & Insights Dev Tools Chrome Extension
Overview
The Contentstack Data & Insights Dev Tools Chrome extension is a comprehensive tool designed to simplify validation, debugging, and exploration of Lytics' client-side capabilities as facilitated by our core and personalization SDKs. With this extension, users can easily:
- Validate that Lytics is connected to your site.
- Debug and validate that the data collected by Lytics, be it automatic or custom, is behaving as expected.
- Explore the current visitor's full profile to validate:
- If the profile is available for personalization.
- The events collected are having the expected impact on attributes and segment membership.
- Explore "Experiences" currently active on your site and could be surfaced to visitors.
Installation
-
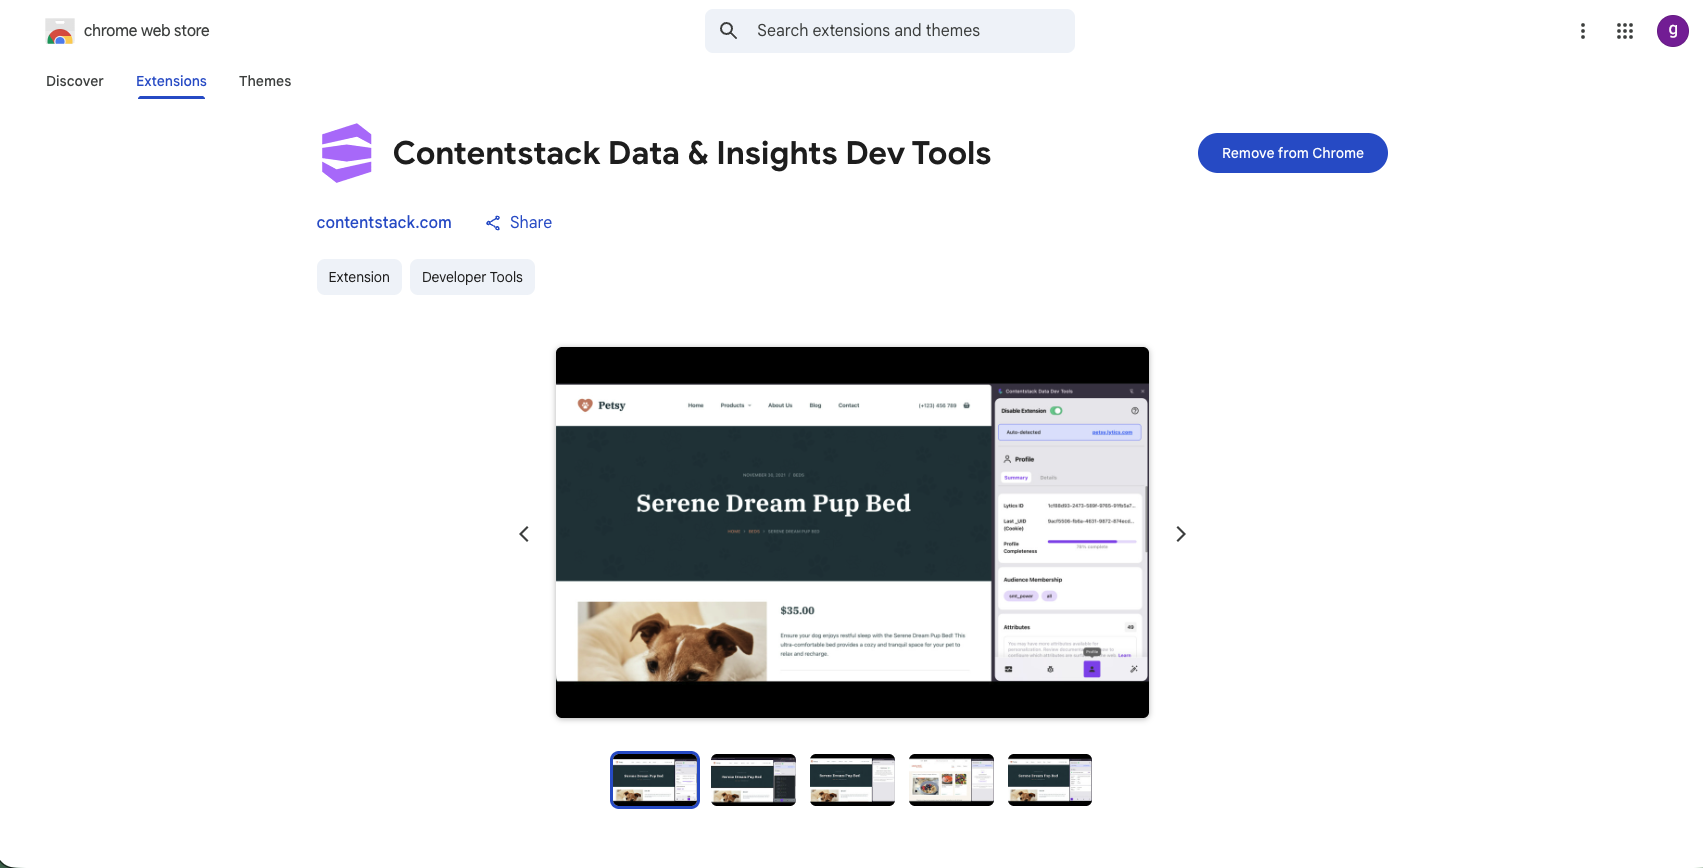
Install Extension: This extension is installed directly into your Chrome browser. To install, visit the primary extension page and follow the instructions.
-
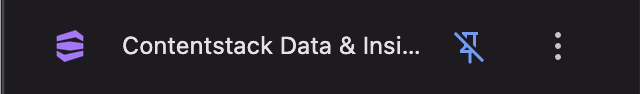
Pin Extension to Nav Bar: Once installed, we recommend pining the extension to your top bar for easy access.
Getting Started
Once the extension is installed, you can visit any website where Lytics is or should be installed and begin debugging.
- Enable the extension: To activate the Lytics Dev Tools extension, open the extension and toggle the slider at the top right of the extension to either "Enable" or "Disable."
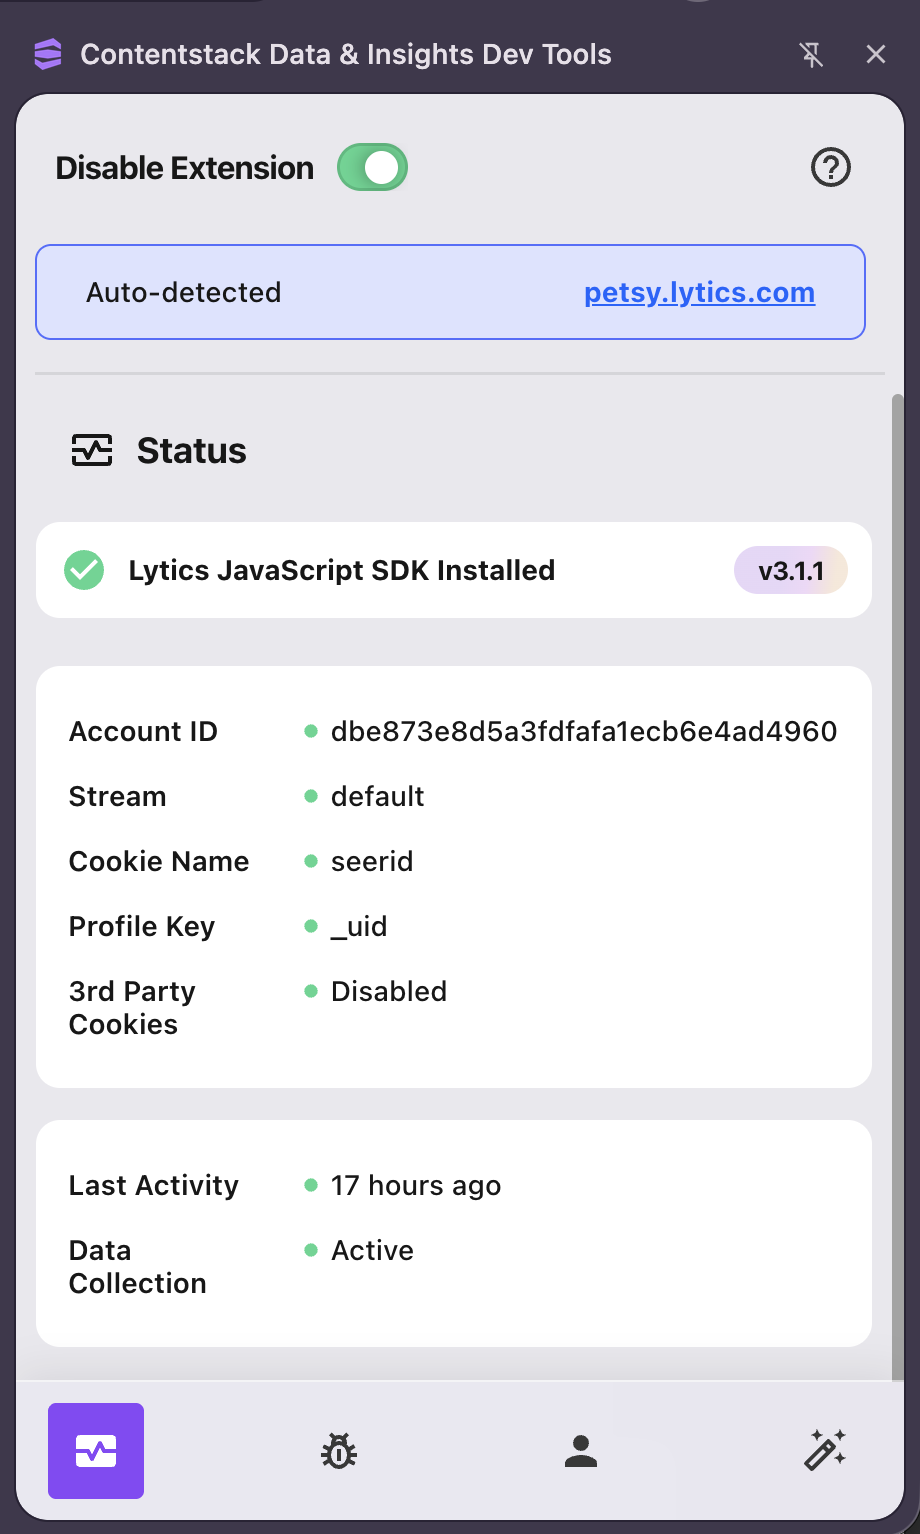
- Verify Installation: The extension will verify that the Lytics tag has been installed successfully before further debugging. This is confirmed by the "Lytics JavaScript SDK Installed" alert displayed on the dashboard of the extension.
- Navigation: Once enabled, you'll access four key sections: Status, Debugger, Profile, and Personalization, each offering specific functionalities tailored to streamline your debugging and exploration process.
Status
The Status section provides real-time visibility into the Lytics JavaScript SDK installation and operational status on the current domain. It automatically detects SDK presence and displays comprehensive configuration details including account ID, stream settings, cookie configuration, and third-party cookie status. The dashboard tracks essential metrics such as last activity timestamp and total requests made today, offering immediate insight into your tag's health and data collection activity. This centralized view ensures you can quickly verify proper SDK implementation and monitor ongoing performance without interrupting your workflow, making it the essential first stop for any debugging or validation task.
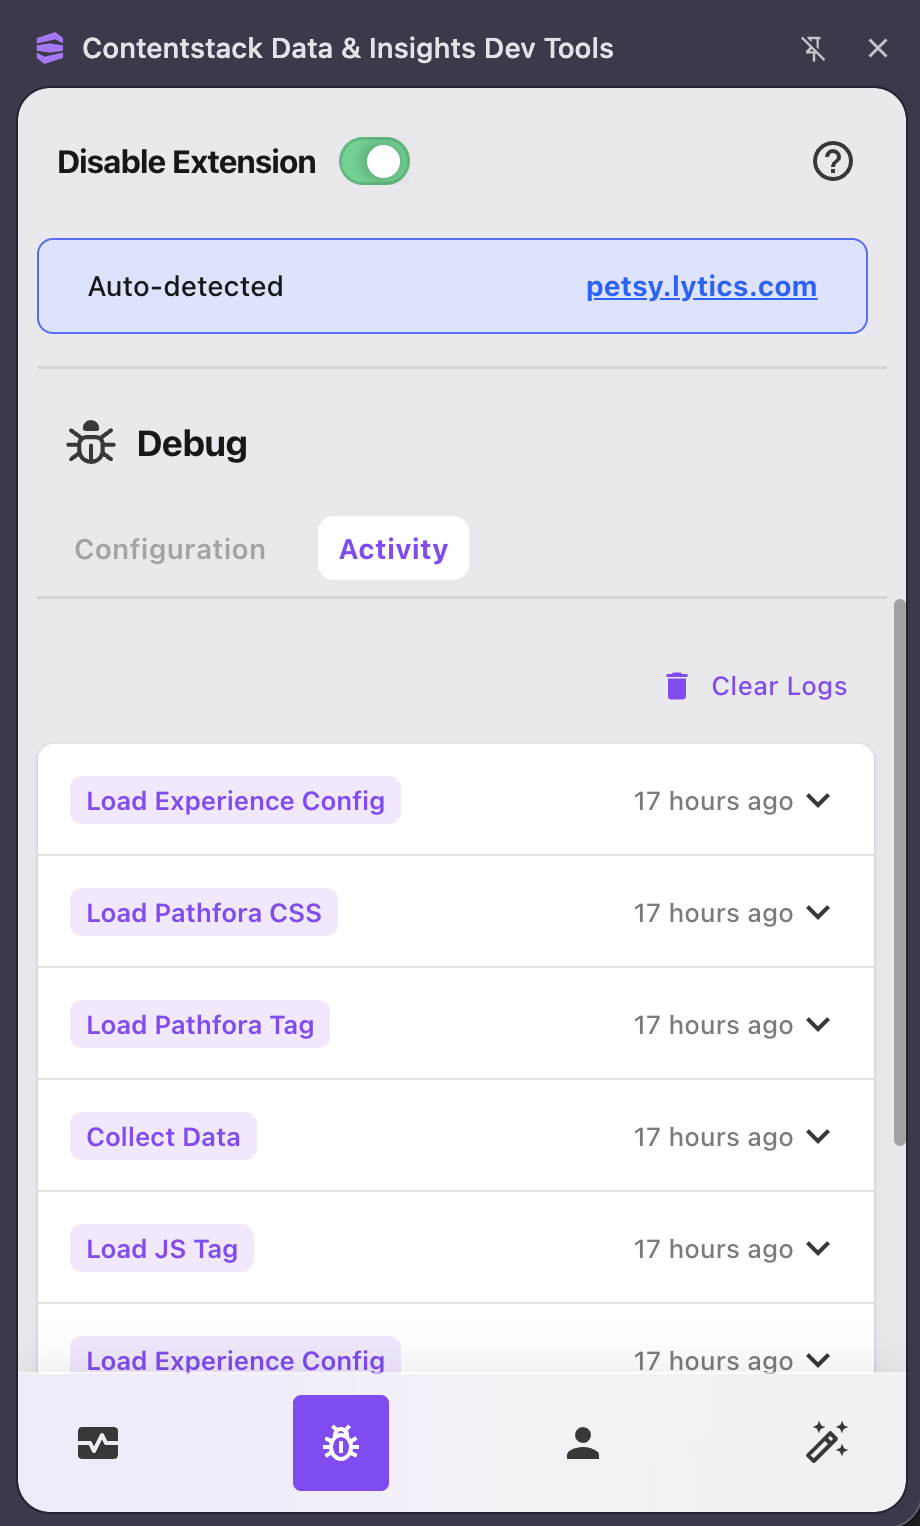
Debugger
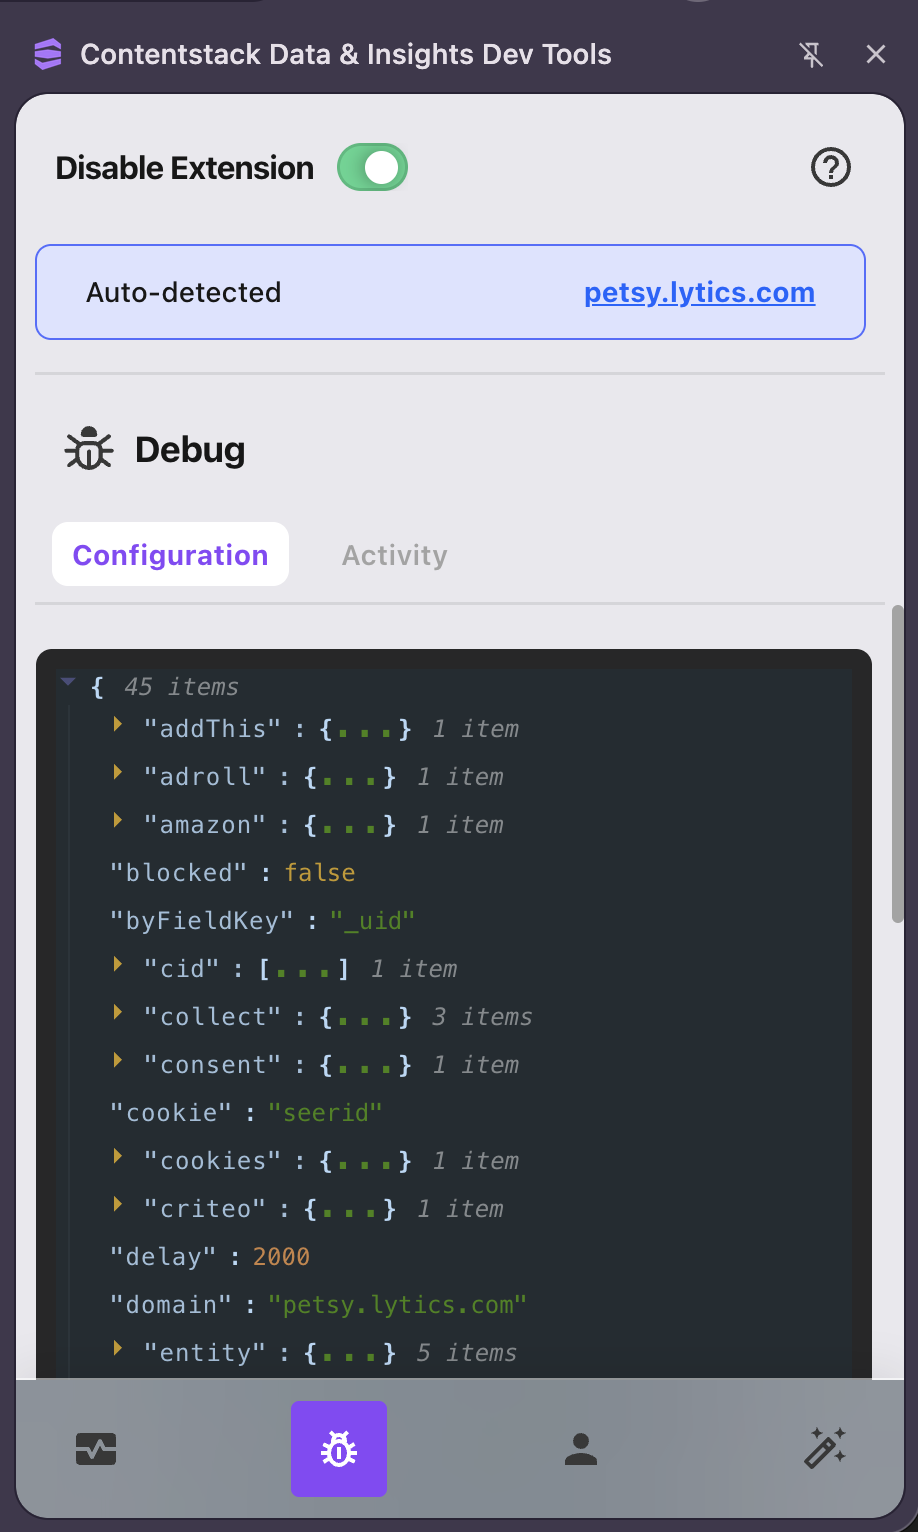
The debugger section of the extension serves multiple purposes. Firstly, as we did previously, it allows you to validate installation, ensuring that the Lytics tag is successfully implemented. Additionally, it provides access to the full active configuration of the JavaScript SDK through the configuration tab. Moreover, it includes a live event debugger that monitors and displays comprehensive details of any calls made to the Lytics APIs in real time. This feature is particularly valuable for reviewing data sent via jstag.send calls, offering insights into the interaction between your website and Lytics APIs.
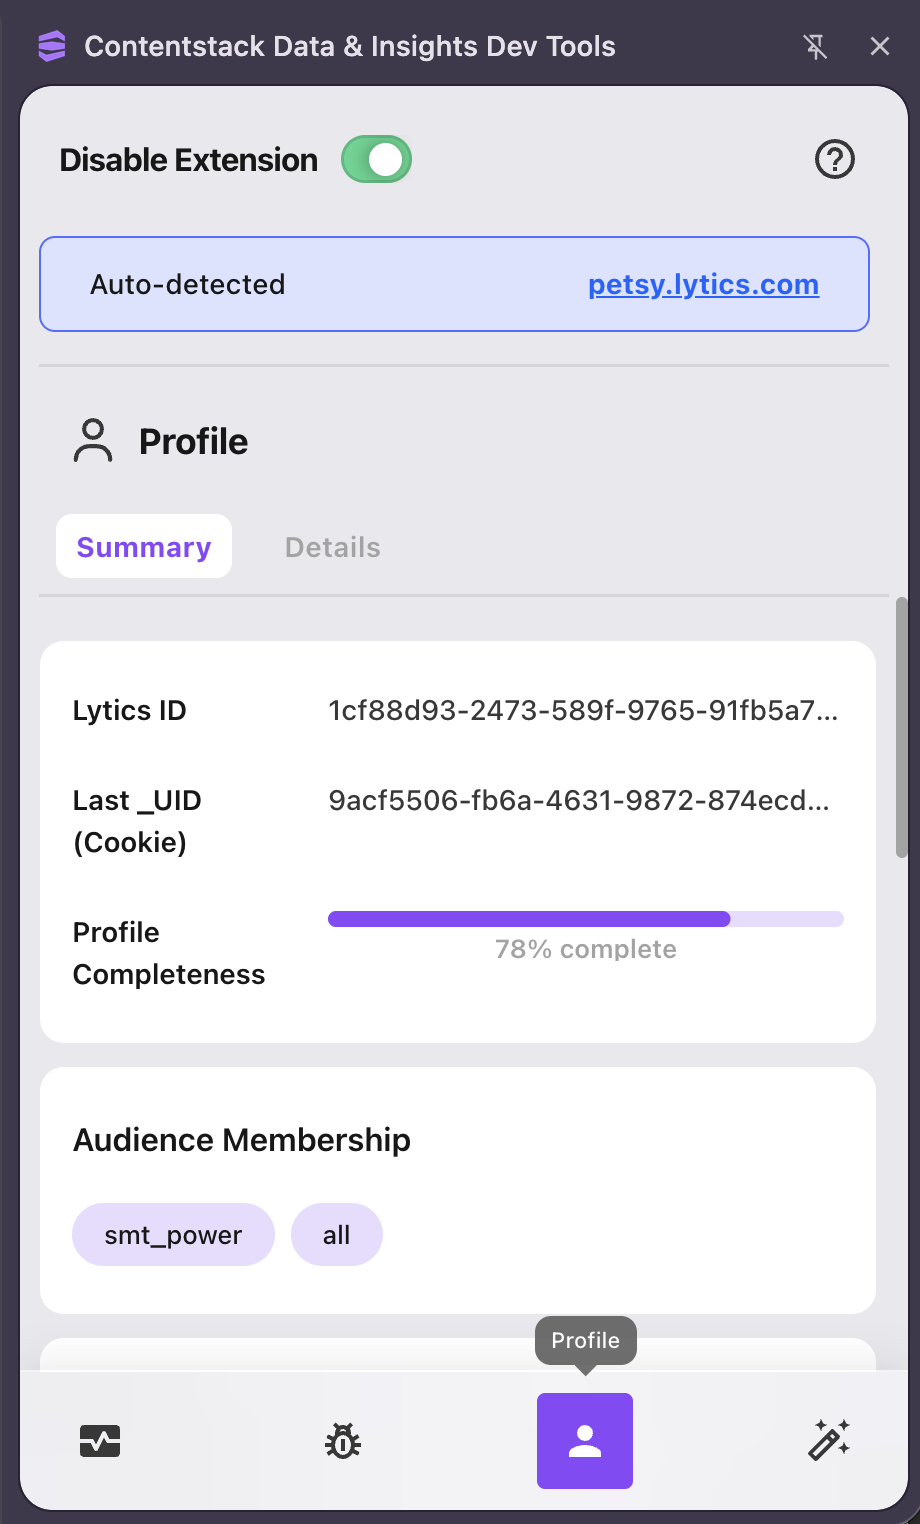
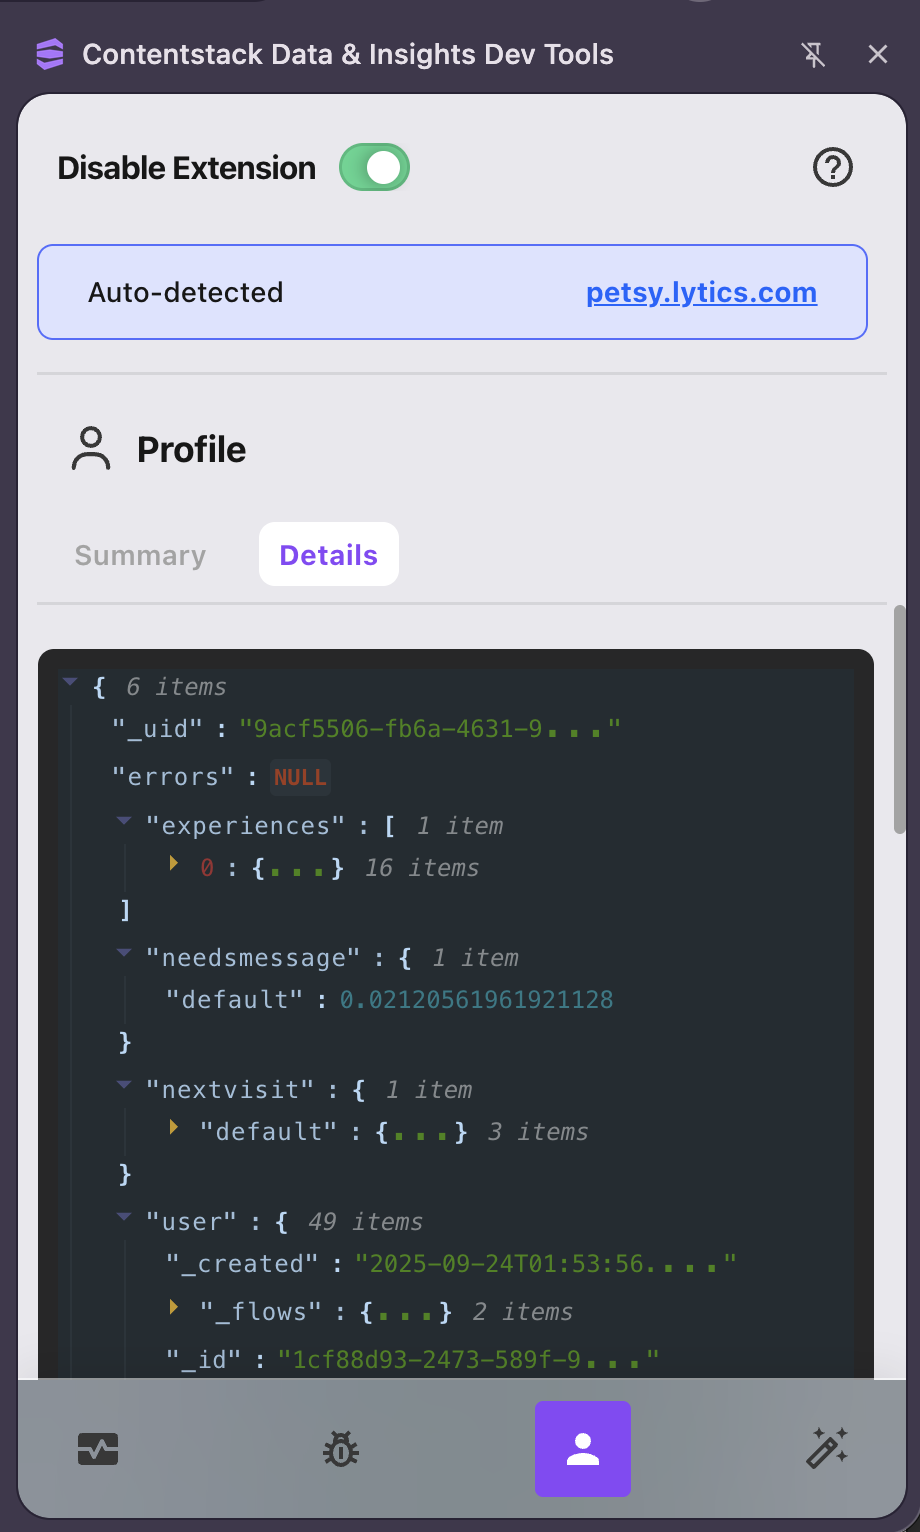
Profile
In the "Profile" section of the extension, users gain a live look at the current visitor's profile, providing valuable insights into their browsing behavior and demographic information. This section offers a snapshot of key details, such as the visitor's unique identifier and behavioral scores, allowing for a quick assessment of their engagement level. Additionally, users can access a detailed view of all information available to the browser, including demographic data, past interactions, and any custom attributes stored in the visitor's profile. This comprehensive overview enables users to tailor their strategies and personalize experiences based on individual visitors' specific characteristics and preferences.
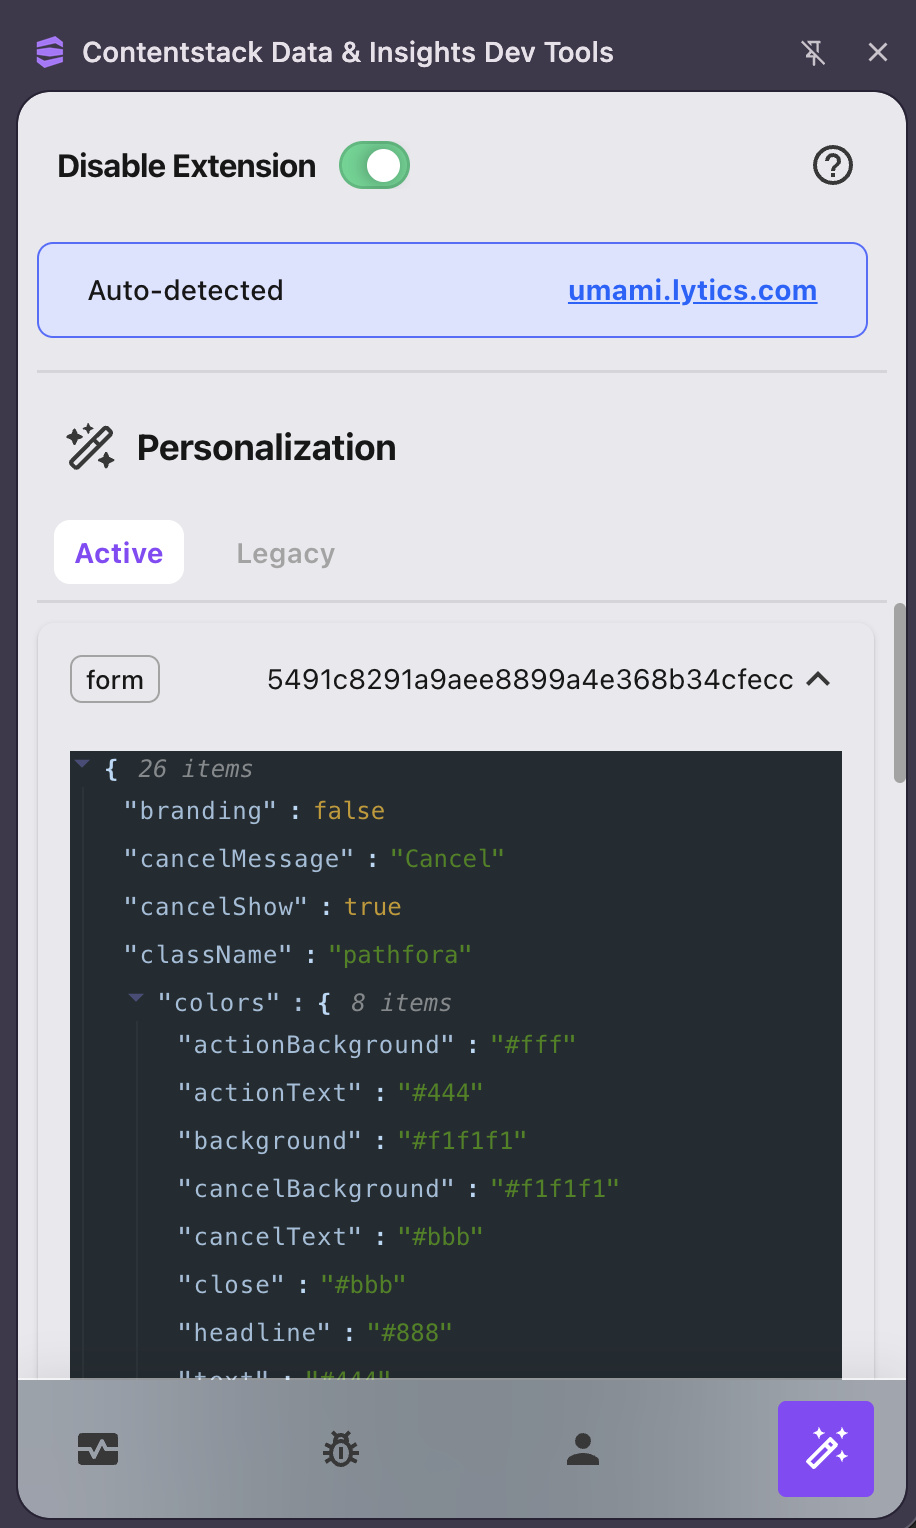
Personalization
In the "Personalization" section of the extension, users gain access to a log of all active Lytics experiences and campaigns, along with their associated details. This feature proves invaluable when debugging the configuration of experiences or ensuring that overrides have produced the expected results. Users can easily track the performance and behavior of each personalized element on their website by providing a comprehensive overview of active campaigns and experiences, including their parameters and settings. This functionality streamlines debugging and empowers users to fine-tune their personalization strategies for optimal effectiveness.
Updated 8 months ago