

Evaluating Lookalike Models
Lookalike Model View

The Lookalike Model summary view is divided into four distinct tabs, each offering valuable insights about your model:
- The initial Summary tab provides an overview of the model, including its configuration, key features, and associated audiences.
- The Audiences tab lists all Audiences that incorporate your Lookalike Model.
- The Configuration tab outlines the settings and parameters used to construct the Lookalike Model.
- The Diagnostics tab presents statistical metrics such as R-squared and AUC scores, offering a detailed evaluation of model performance.
Model Summary
The model summary dashboard highlights the essential metrics of your model, including Accuracy, Reach, and the features it leverages. It also enables you to create impactful predictive audiences, using Lytics' predefined options or custom definitions tailored to your needs.
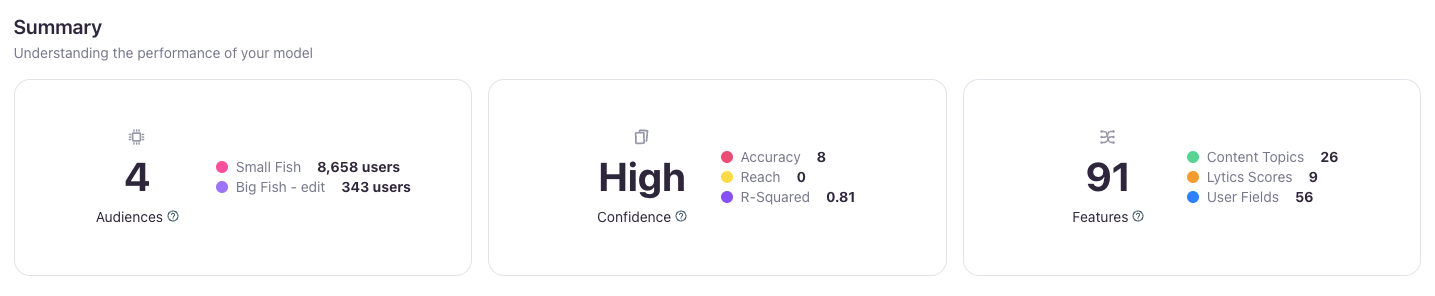
The Summary section at the top of the image above features three key tiles.
- The left tile displays the number of audiences utilizing this model, along with the sizes of the Source and Target audiences involved.
- The middle tile highlights the model’s Confidence, Accuracy, and Reach metrics.
- Lytics determines model Confidence based on the model’s ability to make accurate predictions -- predictions from unhealthy models should not be trusted. Models are considered unhealthy if the accuracy is low (with an R2 value less than 0.1), or if the model is overfit (with an R2 value greater than 0.975).
- Accuracy ([0 - 10]) measures how precisely the Lookalike Model's predictions align with actual outcomes during training. Models with higher accuracy are ideal for narrowly targeting top lookalike candidates, making them well-suited for the later stages of your marketing funnel.
- Reach ([0 - 10]) reflects the relative size of the audience addressable by the Lookalike Model. Models with higher reach are better for broadly targeting larger user groups, making them more effective for earlier funnel stages.
- The right tile shows the total number of features and provides a breakdown of their types.
Model Exploration
The Model Exploration section provides detailed insights into your model and visualizes how users in your Source audience are categorized based on their likelihood to convert to the Target audience.
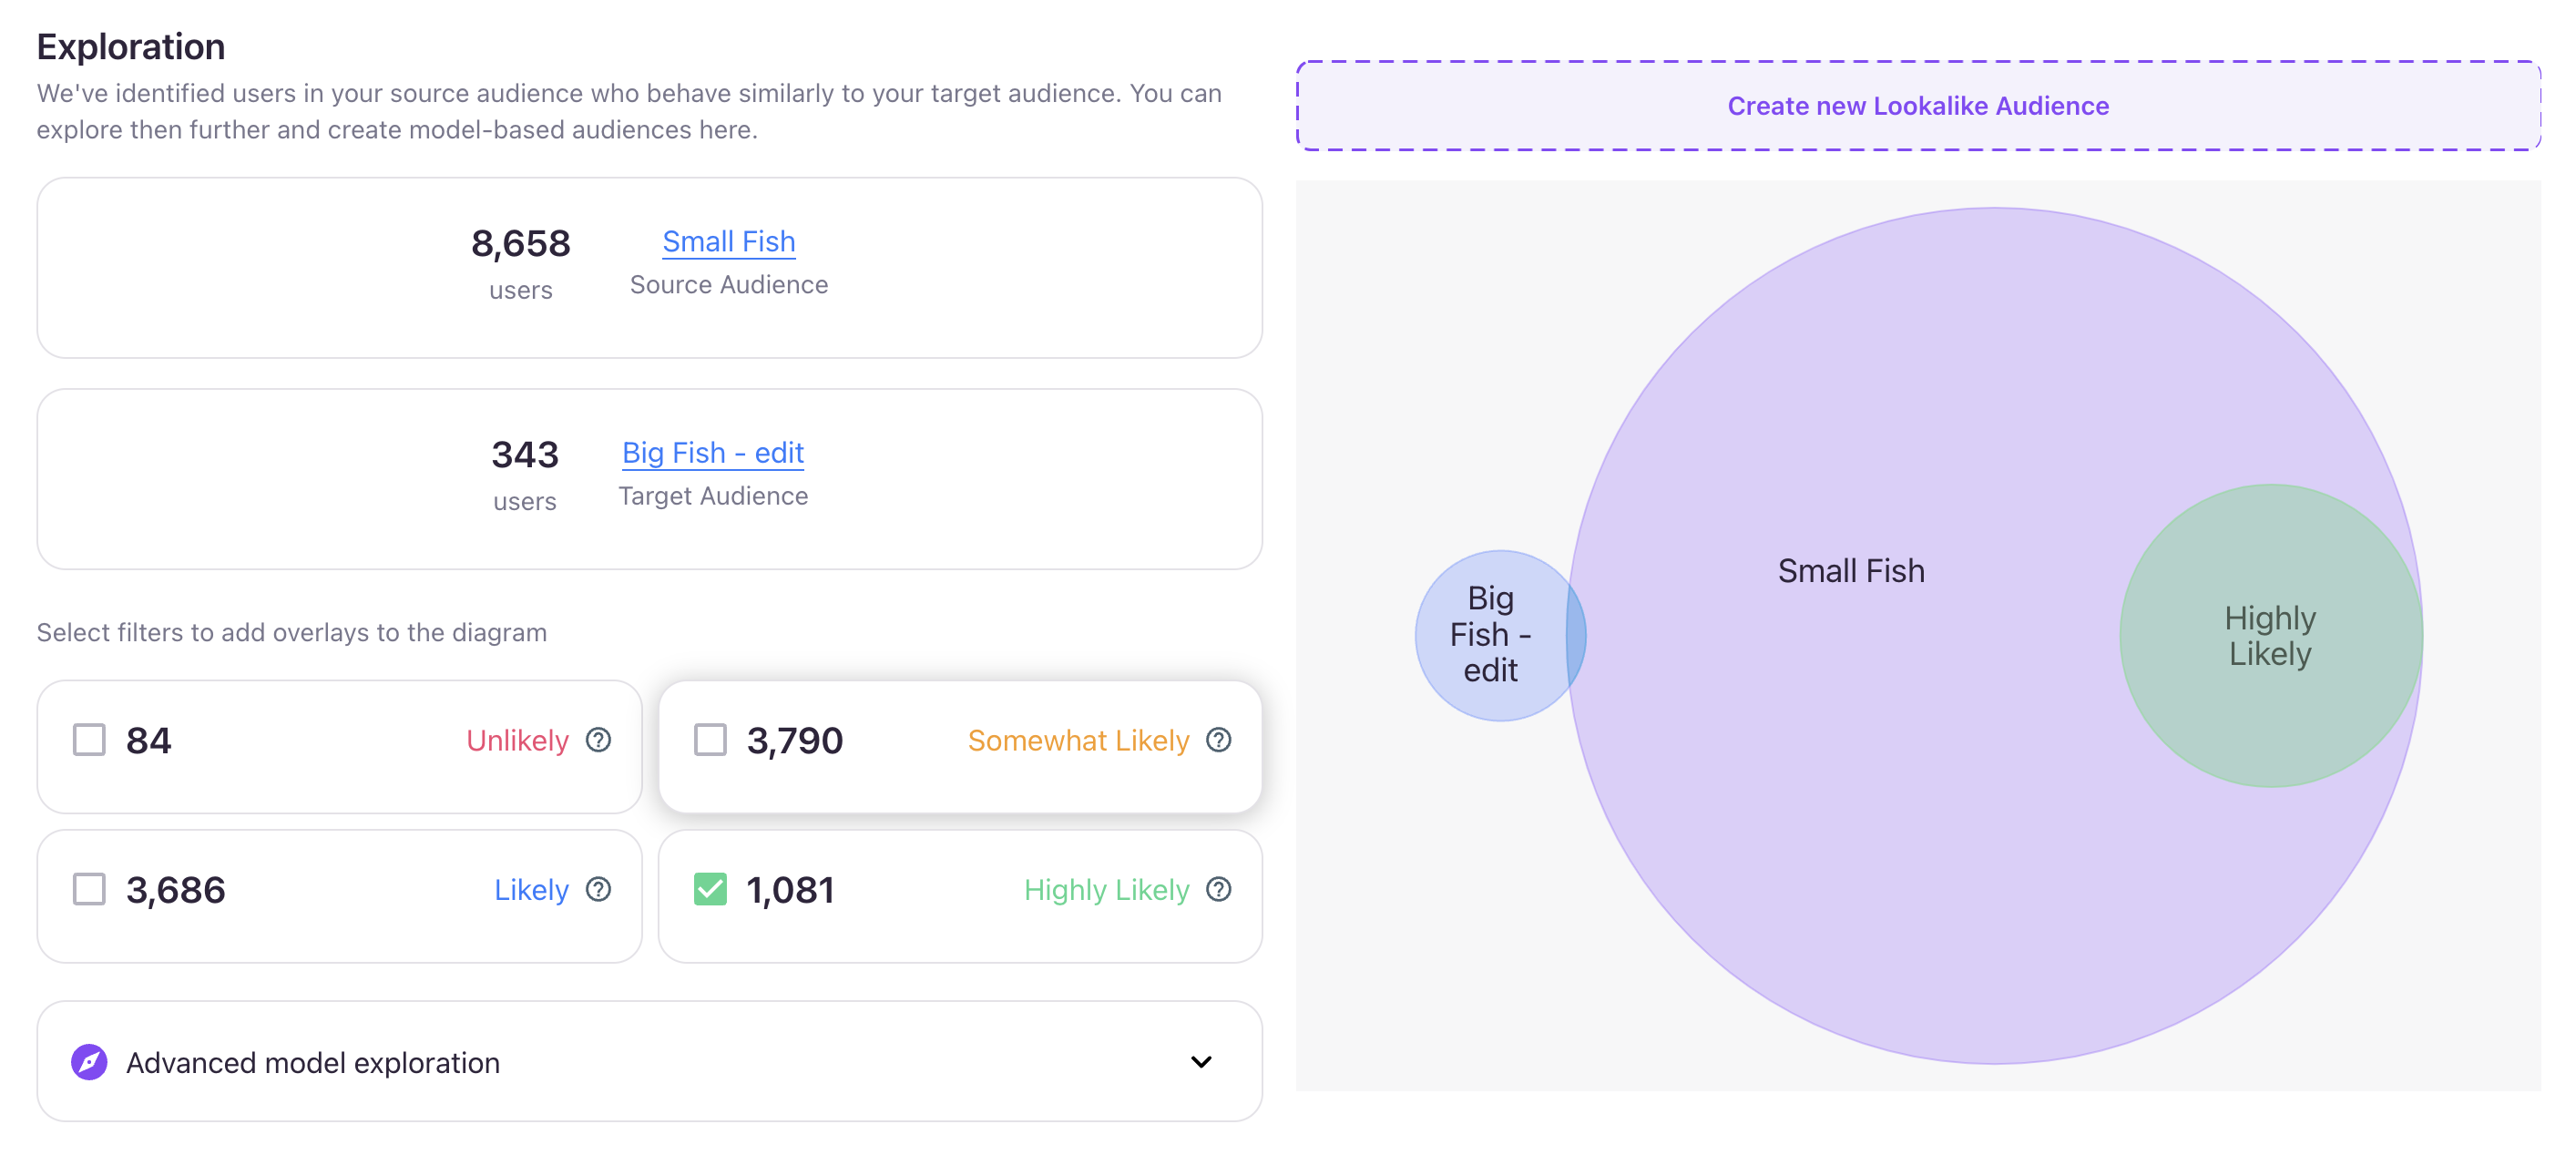
The left side of the image above displays the audience sizes for the Source, Target, and Lytics' predefined audiences:
- Unlikely: users in the Source audience who have a similarity score under the 25th percentile
- Somewhat Likely: users in the Source audience who have a similarity score above the 50th percentile
- Likely: users in the Source audience who have a similarity score above the 75th percentile
- Highly Likely: users in the Source audience who have a similarity score above the 90th percentile
Clicking any predefined audience updates the Venn diagram on the right, providing a dynamic visualization of audience overlap.
Advanced Model Exploration
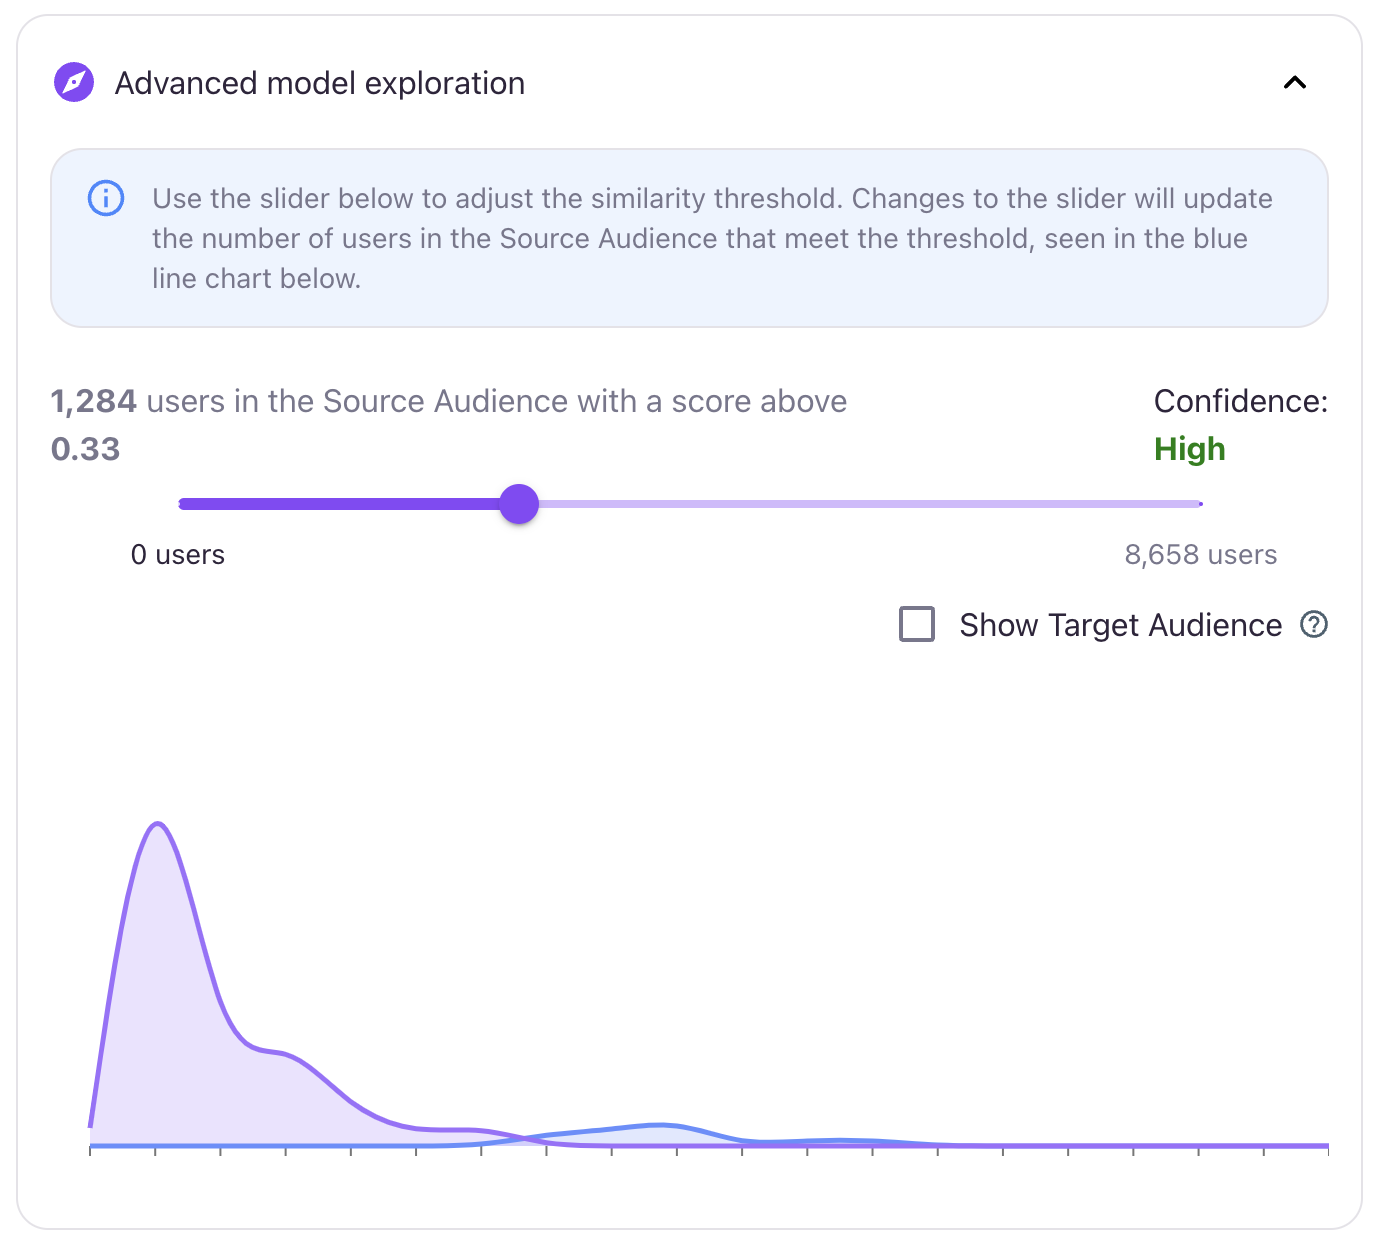
The Advanced Model Exploration feature provides a deeper dive into the relationship between the Source and Target audiences. When open, it displays a detailed chart that highlights the overlap in predictions between the two audiences.
A slider bar within this feature lets you dynamically adjust the similarity score threshold. As you move the slider, the chart updates in real-time to show only users in the Source audience whose similarity score meets or exceeds the selected threshold.
This interactive tool not only offers a clear visualization of how your model performs but also enables you to refine the threshold to better suit your predictive Lookalike Audience. By fine-tuning this setting, you can precisely target the users most likely to convert, enhancing the effectiveness of your predictive audiences.
Creating new Lookalike Audiences
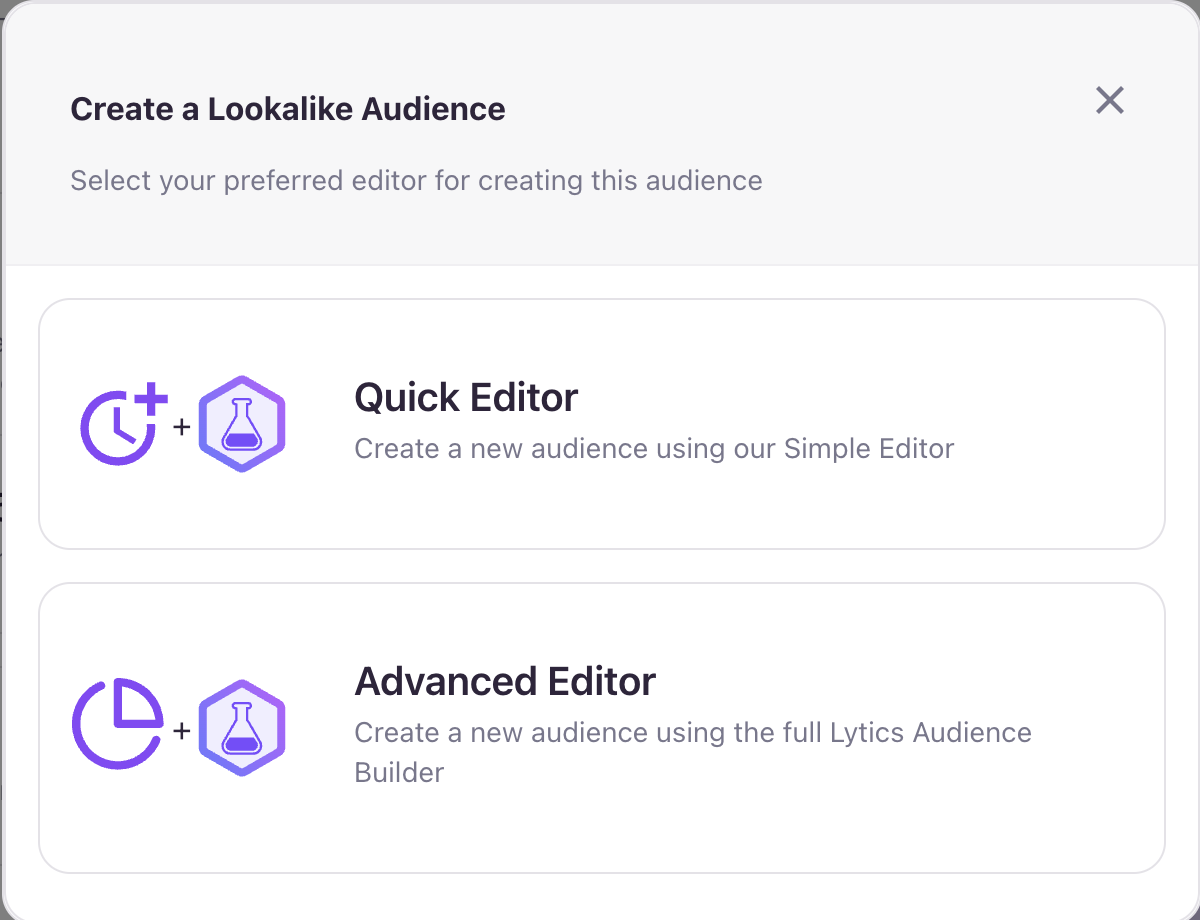
The Create new Lookalike Audience button, located above the Venn Diagram, provides a convenient way to build predictive audiences directly within the Lookalike Model interface. Clicking the button opens a modal with two editing options:
- Quick Editor: Use the streamlined inline audience-builder to quickly create a new audience without leaving the current page.
- Advanced Editor: Select this option to open the standard Audience Builder in a new tab, offering full access to advanced configuration tools and features.
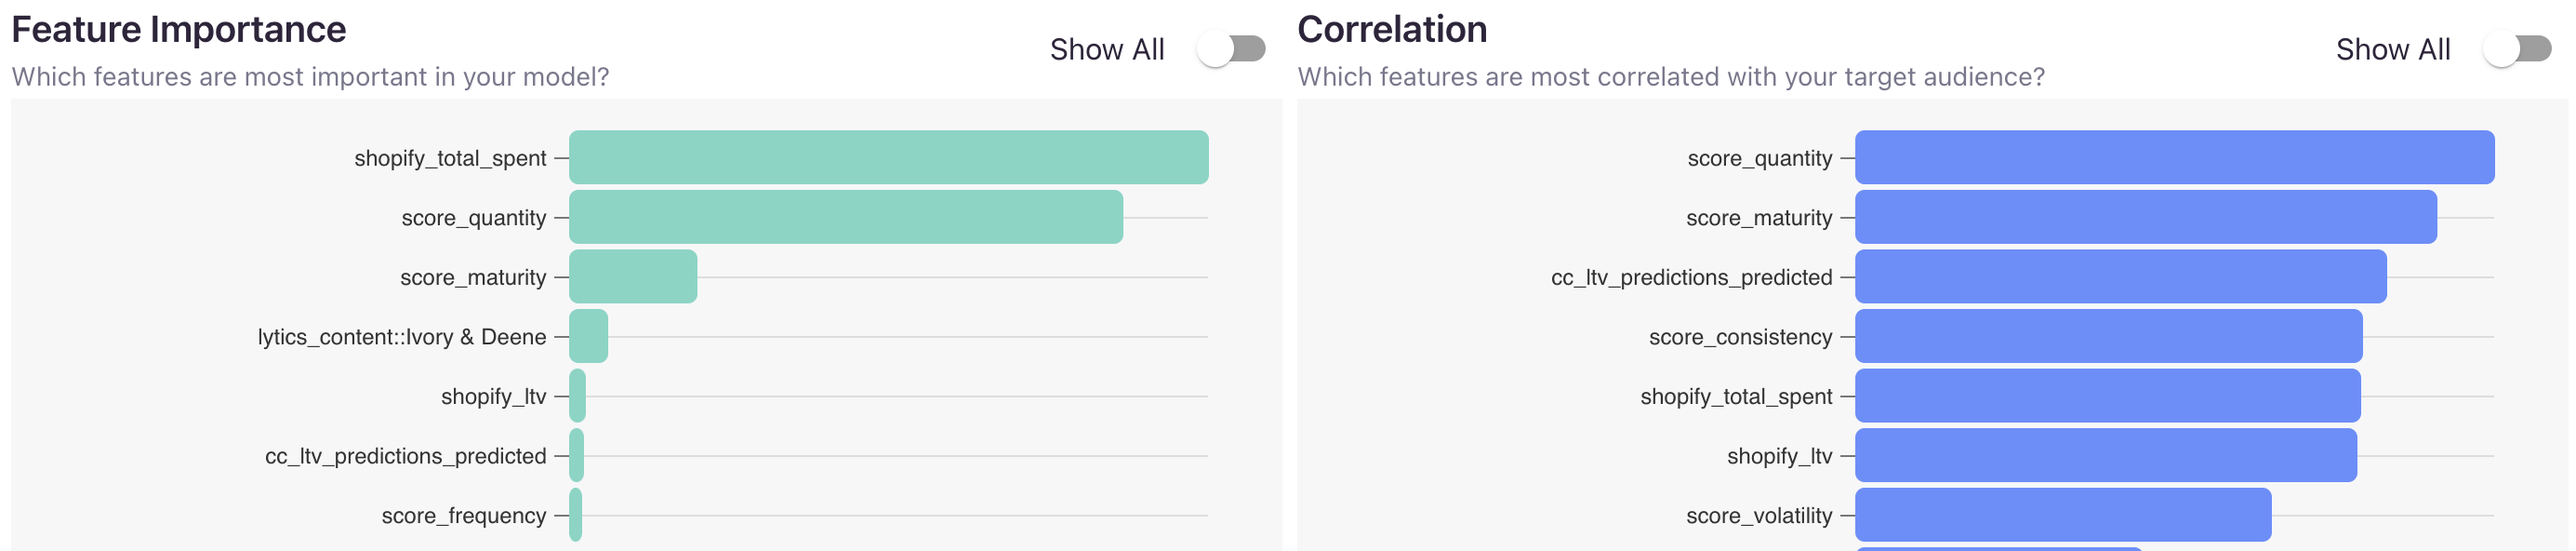
Feature Importance and Correlation
The Feature Importance and Correlation charts highlight the key features influencing user conversions from the Source to the Target audience. The Importance chart ranks these features by their relative importance, as determined by the model, from most to least significant. The Correlation chart ranks features by their correlation to the Target audience.
By analyzing this data, you can gain valuable insights into the characteristics shared between your Source and Target audiences. These insights can help you refine your audience-building strategy, including the option to incorporate specific high-impact features into new audience definitions for improved targeting.
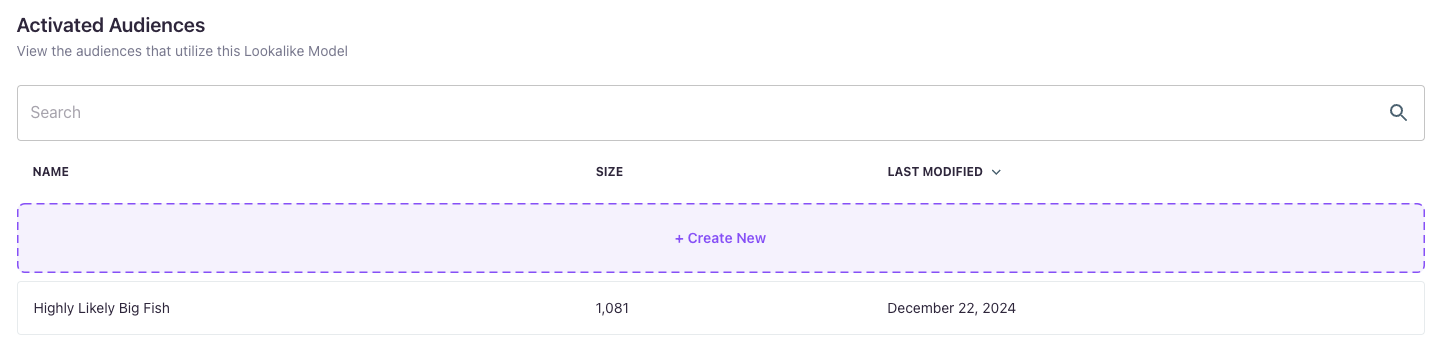
Lookalike Audiences
Once your model becomes Active, you can start creating Lookalike Audiences—predictive audiences that utilize your Lookalike Model. The Audiences tab serves as a centralized hub, displaying all your existing Lookalike Audiences and providing the option to create new ones directly from the interface.
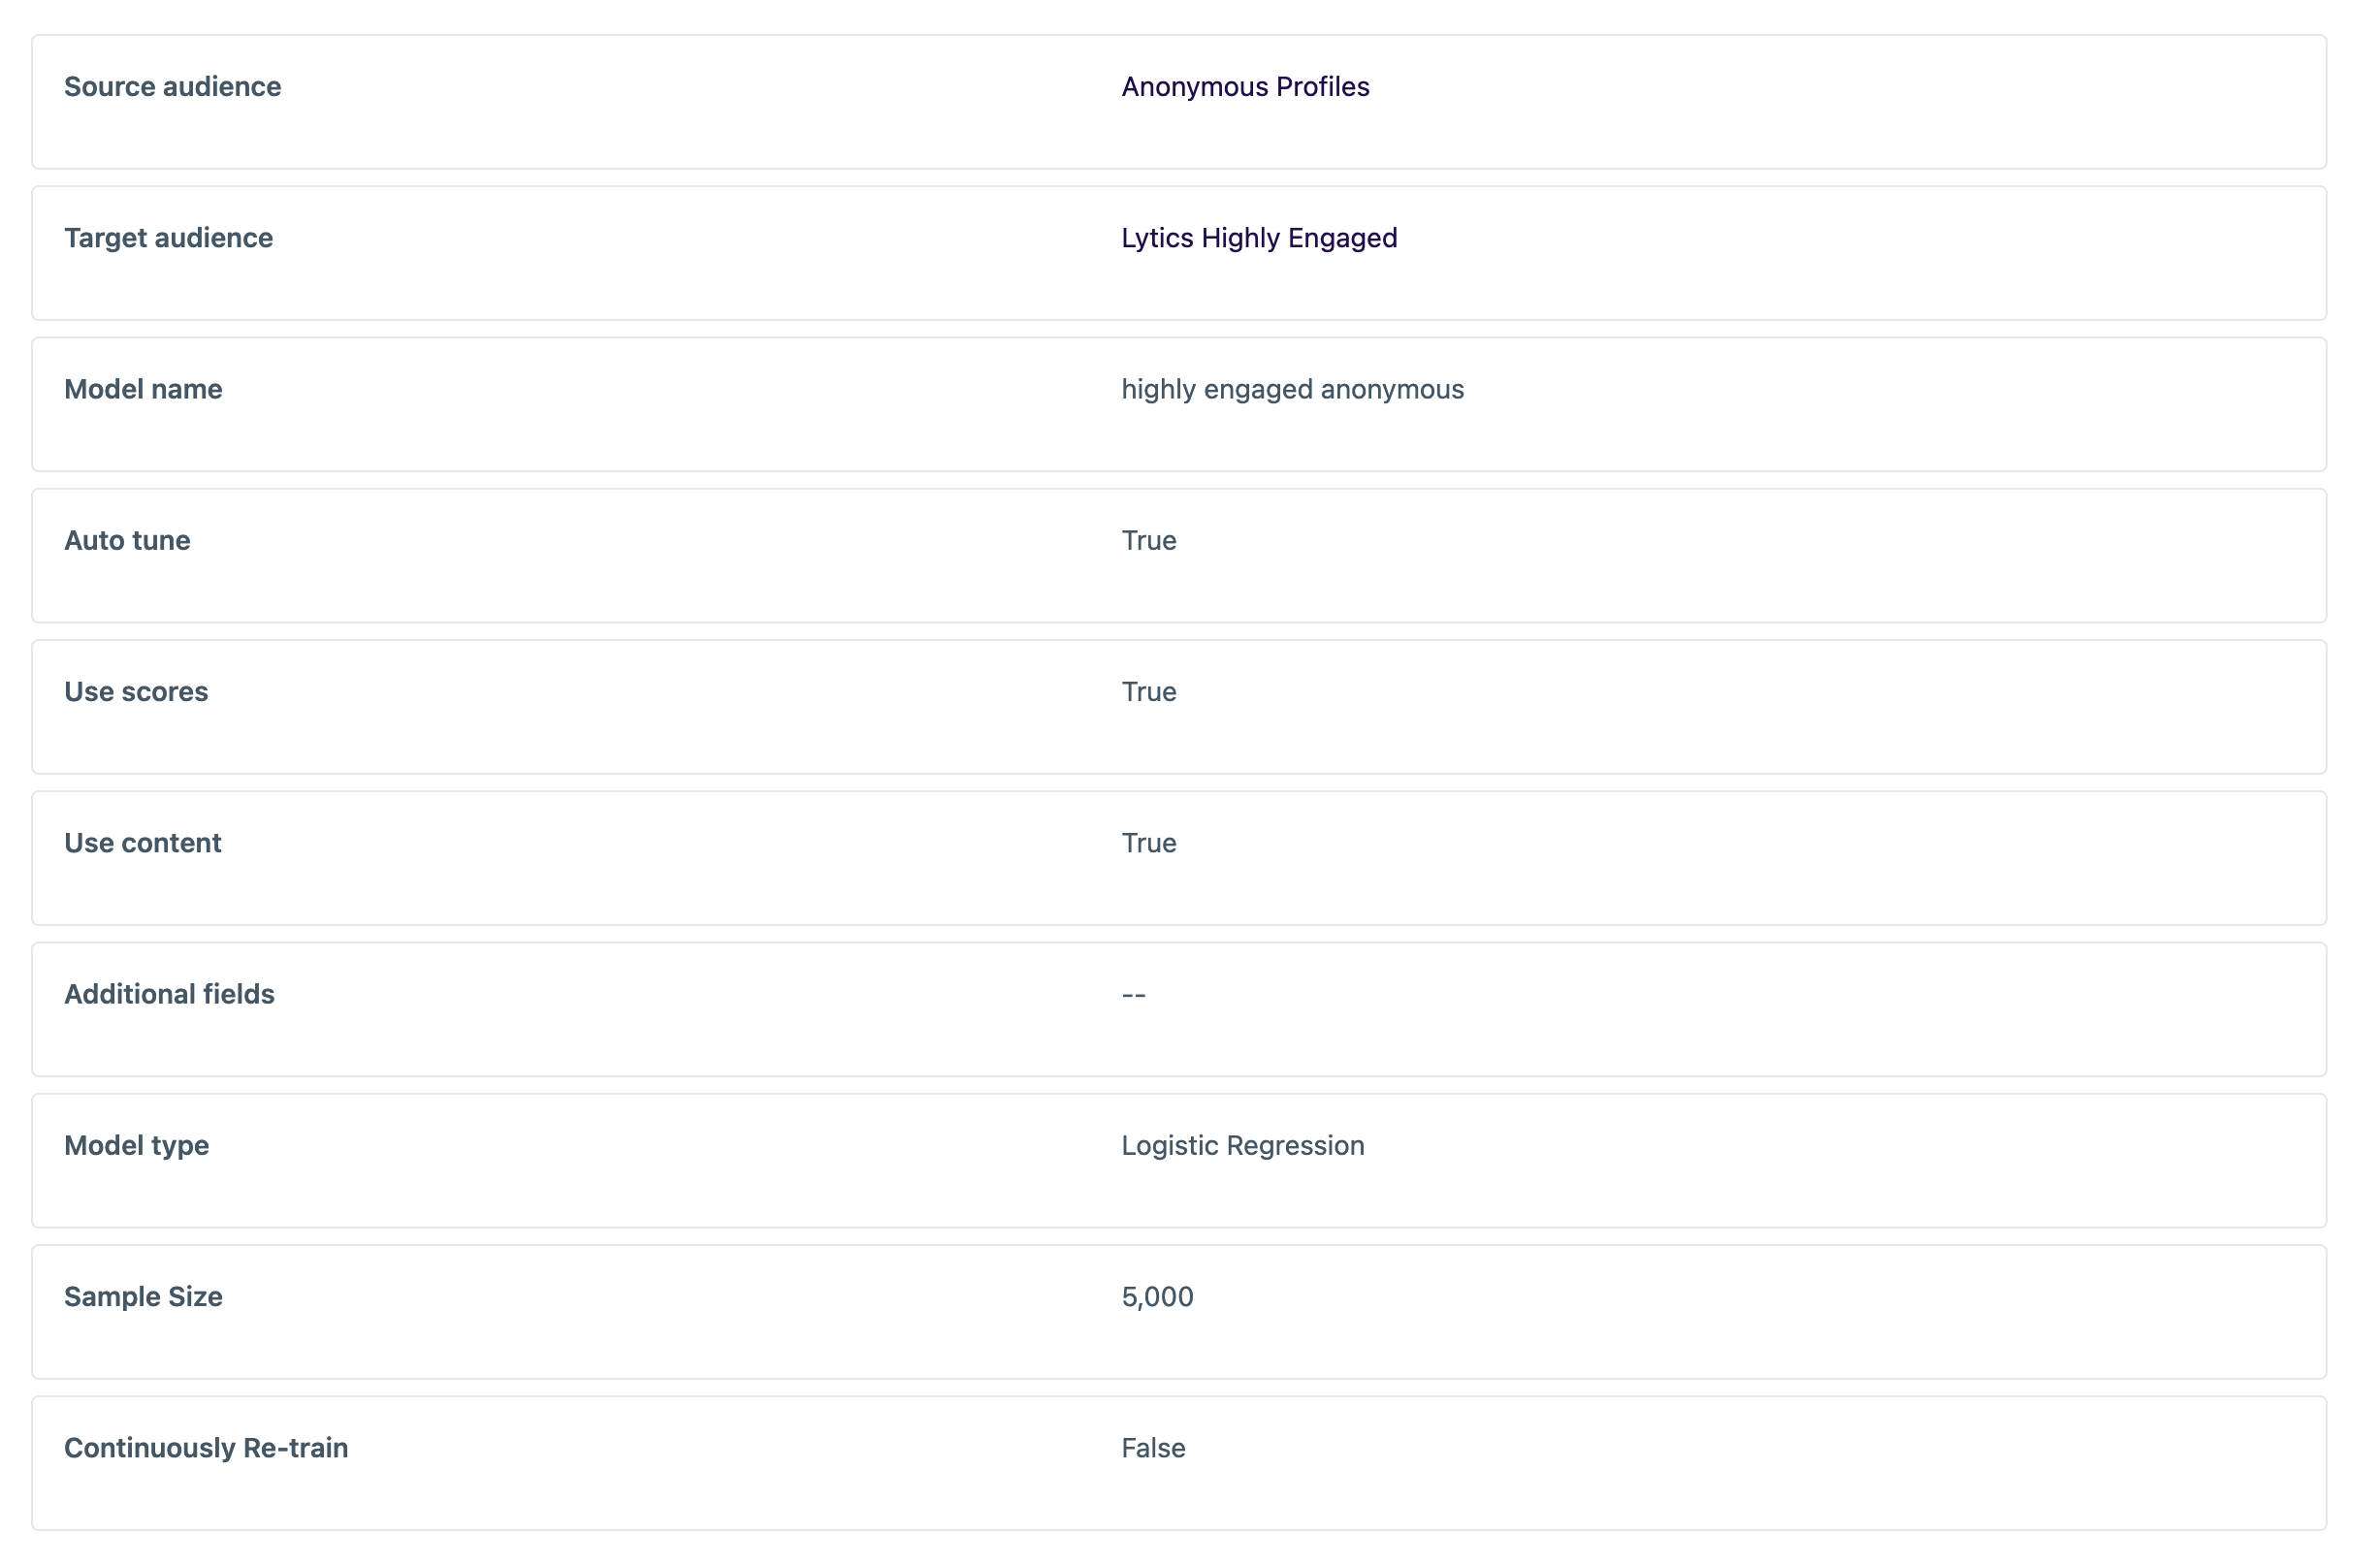
Model Configuration
The Configuration tab displays the settings used when creating the model.
Model Diagnostics
The Diagnostics tab provides an advanced view into a Lookalike Model's performance and can help provide assurance that the model has a robust statistical foundation. This information is helpful for technical users looking to gain extra insight into the data science behind this Lookalike Model.
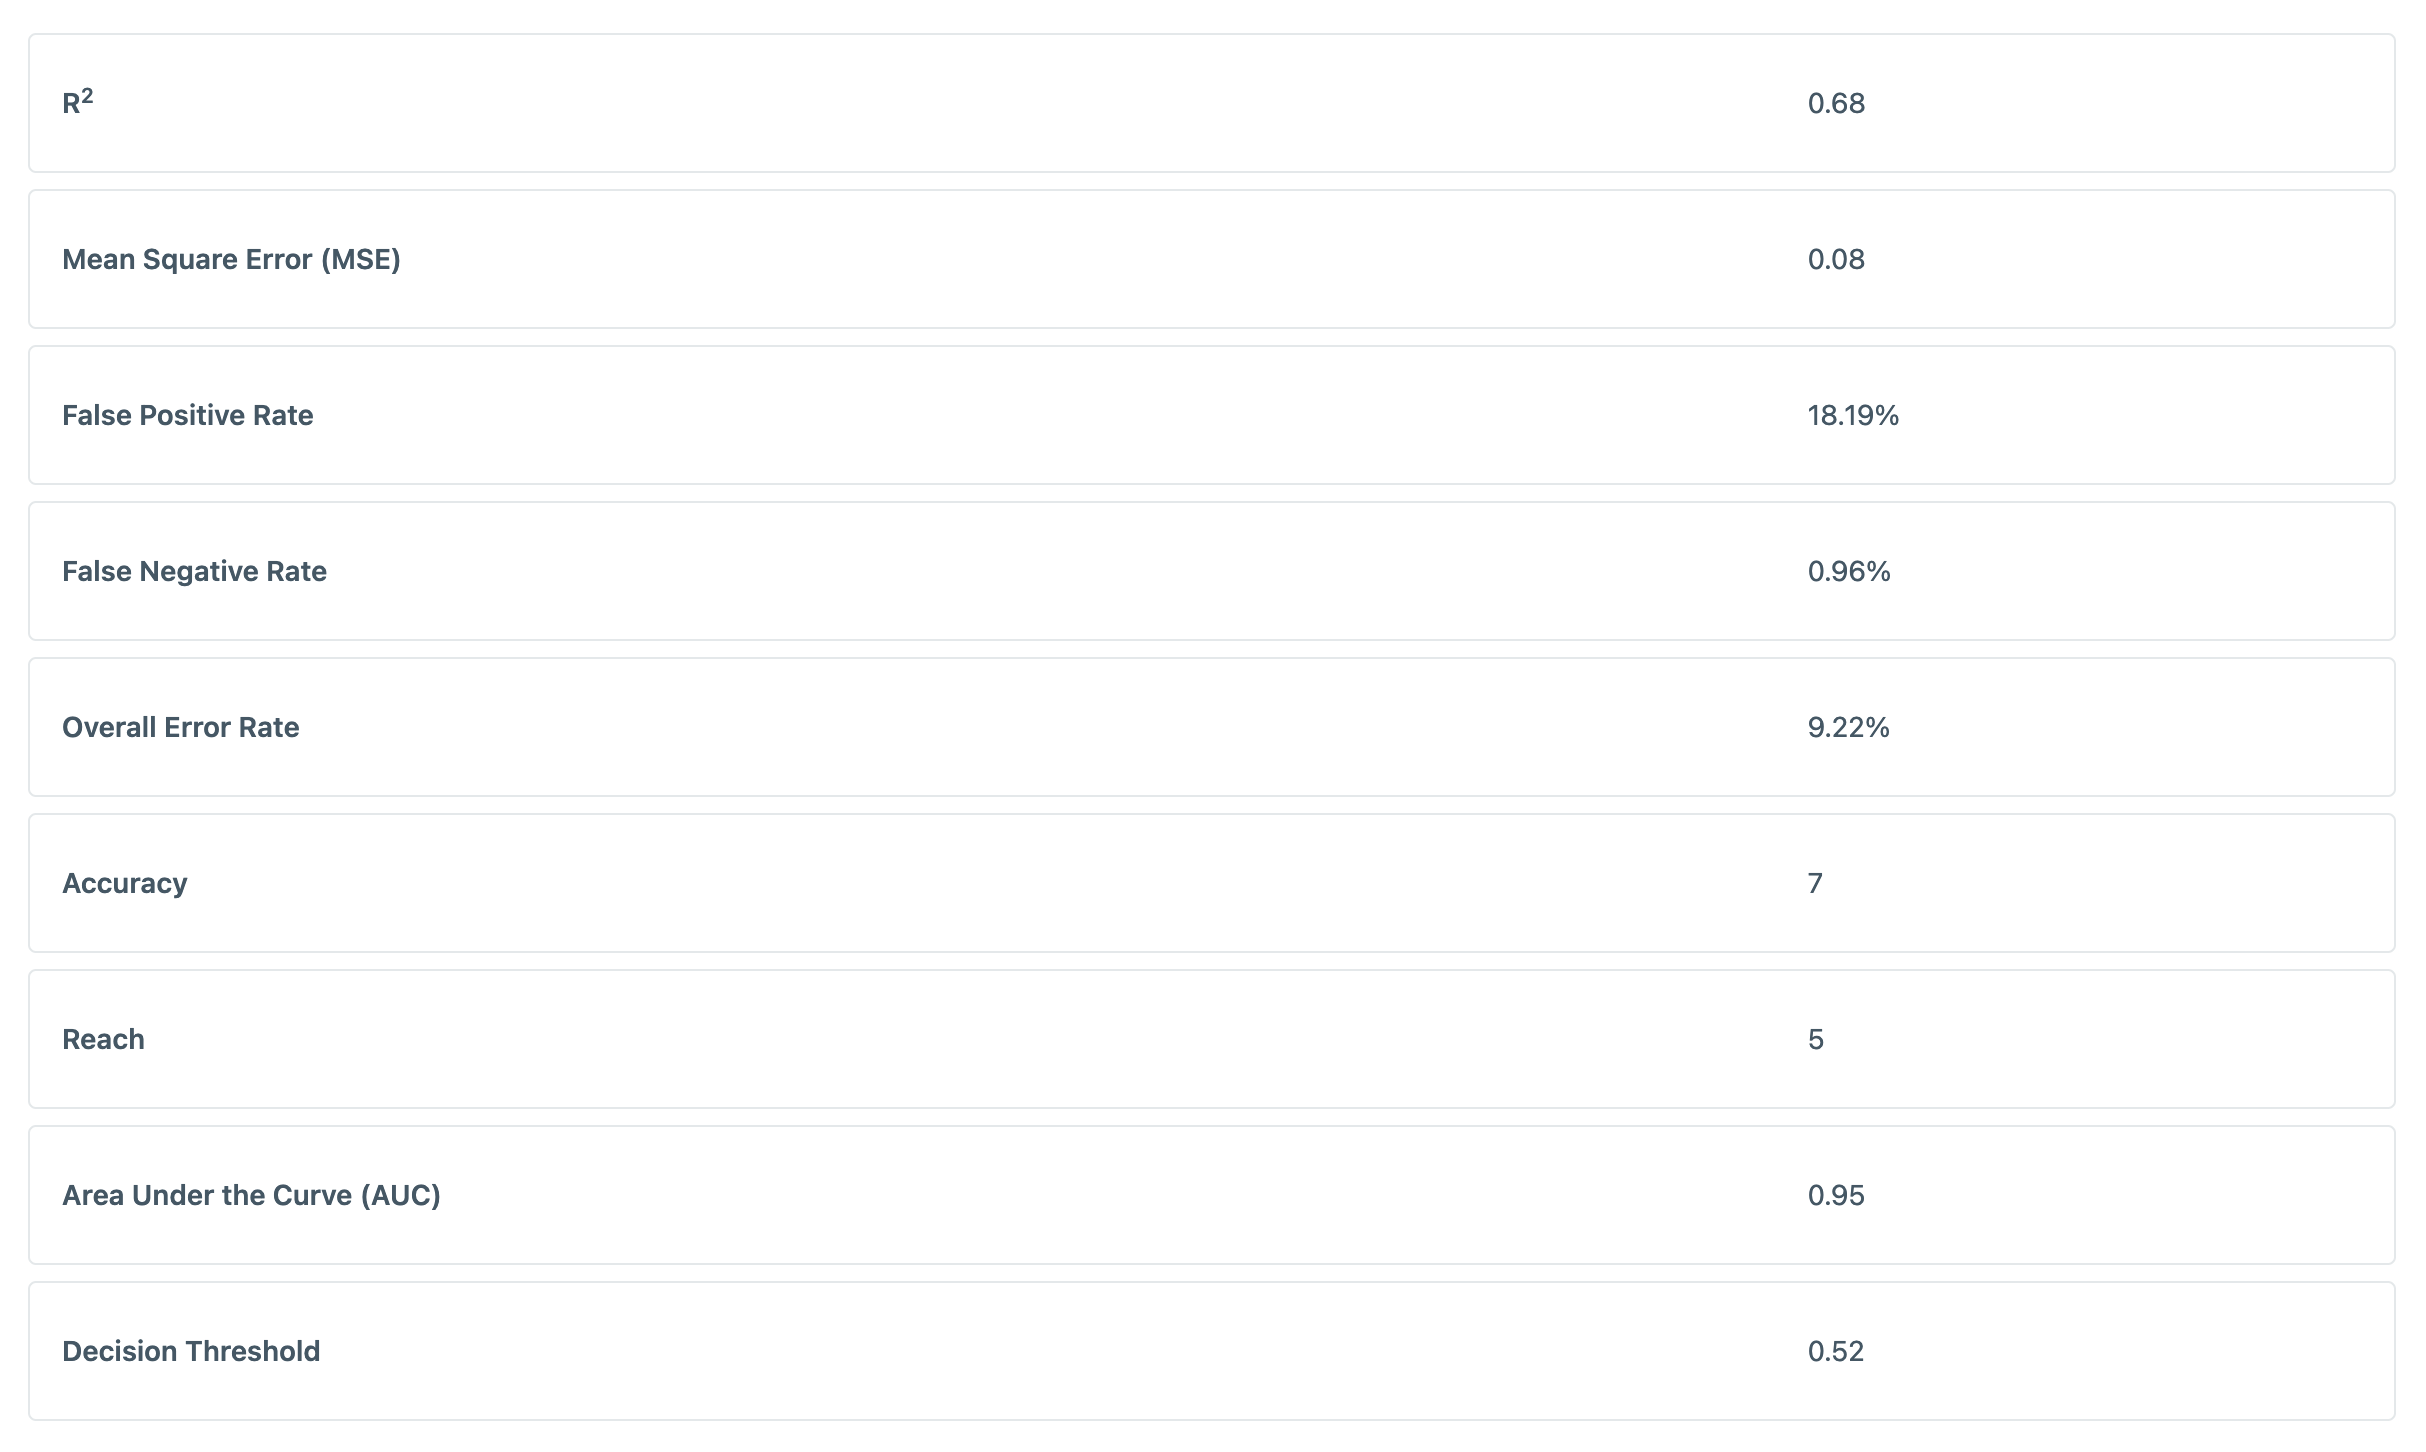
- R2: A measure of how successfully a model is able to predict its desired outcome. It can be interpreted as the percentage of variability in outcome for which the model accounts. A perfect model would have an R2 value of 1, and an ineffective model would have a value of zero.
- Mean Square Error: A measure of how closely a model’s predictions matches actual outcomes. The scale of MSE has no inherent interpretability. When comparing two similar models, a lower MSE would indicate a better fit.
- False Positive Rate: The percentage of “false positives” in a model -- that is, percentage of users in the source audience that the model misclassified as users in the target audience. While the false positive rate shouldn’t be too high, a large false positive rate tends to yield a model with higher reach.
- False Negative Rate: The percentage of “false negatives” in a model -- that is, percentage of users in the target audience that the model misclassified as users in the source audience. A lower false positive rate means that a model succeeds in correctly identifying the latent characteristics of the target audience.
- Overall Error Rate: The total percentage of misclassifications that occurred during model training.
- Accuracy: A measure derived from a model’s R2 value, rounded to the nearest decile.
- Reach: A measure derived from a model’s specificity value, typically ranging from 0 to 10. A larger value of reach indicates a larger proportion of the source audience that behave similarly to the target audience.
- AUC: A measure of the area under a receiver operating characteristic curve (or “Area Under the Curve”). ROC curves are used to determine the optimal decision threshold for a given model.
- Decision Threshold: The “optimal” model prediction value to use as a cutoff when constructing an audience definition. This threshold is calculated assuming that a false positive should have the same “penalty” as a false negative.
Activating Lookalike Models
When you're ready to start using your model, you can Activate it to calculate and assign similarity scores to your user profiles. Once activated, the process may take up to an hour to fully calculate and save the scores.
Deactivating a model stops the scoring process, meaning that neither new users nor existing users will be scored by the model moving forward. However, any users who already have scores will retain those values, even after the model is deactivated.
Updated 10 months ago