

Behavioral Scores
Learn about Lytics' Behavioral Scores
Overview
Lytics uses data to create more data through a suite of data science techniques. The purpose is to synthesize raw, impenetrable data into something insightful that can be utilized effectively in campaigns.
This synthesis, like all data in Lytics, is applied at the user level. While aggregated analysis may be helpful for looking at trends in customer behavior, user-level analysis can be utilized for one-to-one marketing. Much like how the Lytics Content Affinity Engine allows for immediate targeting and execution using content affinity audiences, Lytics descriptive and predictive modeling allows for immediate targeting and execution using behavioral analysis.
Behavioral Analysis
Lytics constantly tracks events from many data sources: web, email, Salesforce, and custom sources as well. Looking at this data directly is not useful; it needs to be summarized. Lytics allows for simple summaries by means of user fields and for use in audiences, but there is more to be learned from all this behavioral data.
Behavioral analysis asks many questions and computes the answer. Questions such as:
- When did the user last visit?
- When did they visit before that?
- Is it unusual that they visited right now?
- During their visit, what were they up to?
- Did they visit a lot of pages?
- Did they stick around for a long time?
- How does that compare to other users?
- Are they going to come back?
- Is this a good time to encourage more interaction?
After finding the answers to these questions, for every user, Lytics uses these answers to inform nine low-level scores that get assigned to every user who has shown enough behavior for a confident assessment.
These scores are computed automatically, they are kept up to date continuously, and they are assigned relative to other users in the account.
Behavioral Scores
There is a lot to learn looking at user-level behavioral data. Lytics evaluates behavioral data automatically in real-time and reports nine scores for each user.

These scores each represent a distinct behavioral quality and can be composed to build rich audiences. Please note, users must have behavioral data to make confident measurements before they have scores. If a user was added to Lytics via email upload, for instance, they would have no scores.
| Score | Description |
|---|---|
| Quantity | Measures a user's cumulative activity over their lifetime of brand engagement. |
| Frequency | Measures how often a user is interacting with your brand over time. |
| Recency | Measures how recently the user's general interaction has been. |
| Intensity | Measures the depth of a user's typical interaction with your brand. |
| Momentum | Measures the rate at which users are interacting with your brand. |
| Propensity | Predicts how likely a user is to return with subsequent activity. |
| Consistency | Measures the regularity of a user's engagement pattern. |
| Maturity | Measures how long a user has registered interactions with your brand. |
| Volatility | Measures how sporadic a user's behavior is while interacting with your brand. |
Note: If you are already a customer of Lytics, you can see the following explanation of each score alongside your own data in the app on the Scoring page.
Quantity
Quantity measures a user's cumulative activity over their lifetime of brand engagement. The more activity the user registers, the higher the score. This score measures the user relative to all other users.
It is a common tactic to target a user based on the number of times the user has visited a website or has performed some other behavior. This becomes increasingly difficult as marketers add more data sources to their stack, and the user continues to engage over time.
Quantity takes into account a user's behavior on all data sources and measures that relative to how the most and least active users are engaging — so a user's score will always be between 0 and 100. You can think of this as a test score.
What is the point of scoring between 0 and 100? This is how we can ensure that any audience created with a score will always stay relevant. Perhaps 1,000 page visits seems like a lot for a user now, but the number will only grow larger as your site grows older and the amount of content you have increases. Another benefit of having a bounded score range is the ability to see the complete distribution of all users.

This is an example of how scores look like across an entire audience. The x-axis is the score (ranging from 0 to 100; 5 to 95 in the example for clarity) and the y-axis is the number of people who have that value as their score.
Frequency
Frequency measures how consistent a user is interacting with your brand over time. More frequent interactions means a higher score. This score measures the user relative to all other users.
This serves as a measurement of user regularity. Do they visit once a week? Once a day? Once a lifetime?
Since this score is relative to all your users, you can easily target your most frequent users, rather than something like "users who visited in the last week", which will vary wildly in size.
Again, this score has a fixed range of 0 to 100. All the scores are like this. It is how we can continuously update user profiles without having to update audience definitions.
Recency
Recency measures how recently the user's general interaction has been. More recent activity means a higher score. This score measures the user's recent activity relative to the user's past activity.
Without scoring, this would be achieved by looking at the last time a user visited. Although better than nothing, that approach is kind of crude. Maybe an at-risk user opened your email by accident? It'd be an expensive oversight to assume that the user had recent activity and didn't need any nurturing.
Intensity
Intensity measures the depth of a user's typical interaction with your brand. More sustained intense/deep usage means a higher score. This score measures the user relative to all other users.
The behavior a user exhibits during a single session is very telling of them as a consumer. If they have high interaction in a session (high intensity) they are more likely to be a deeper researcher or more curious. If they have low interaction in a session (low intensity) they are more likely to be casually browsing or engaged with a certain piece of content, but not your overall brand.
Momentum
Momentum measures the rate at which users are interacting with your brand. Users who are interacting more than usual with your brand will have a higher score. This score measures the user's recent activity relative to the user's past activity.
It's easy to confuse how momentum and recency differ, but they are actually very different. Universally speaking, we've found them to have a 5% correlation. Recency measures absolute recency of activity, but just because a user has recent activity, doesn't mean they're not at risk of churning.
If a user maintains a constant rate of activity, their momentum score will be 50. If they are more active than they used to be, their momentum will be greater than 50 and might warrant a loyalty offer. If they are less active than they used to be, their momentum will be less than 50 and might warrant a win-back campaign.
Propensity
Propensity predicts how likely a user is to return with subsequent activity. Users exhibiting positive interaction patterns are more likely to return and have higher scores. This score measures the user relative to all other users.
There are many reasons why users churn — changing interests, competition from competitors, bad experience, etc. — but from a data perspective, attrition of any kind starts to look similar.
Propensity employs an ensemble of statistical models to identify any patterns it can find for detecting how and when attrition starts to occur. With time, it's able to find more patterns in your data and become increasingly accurate in identifying when users start to exhibit those behaviors.
Consistency
Consistency measures the regularity or stability of a user's engagement pattern. Users who engage with your brand at a regular cadence will have higher scores. For example, a user that registers behavior every 7 days will have high consistency, and would have the same consistency as a user who registers behavior every 30 days. As users' behavior starts to vary — sometimes every 7 days, sometimes every 30 — the users' consistency score will decrease.
Consistency scores can be paired with propensity scores to build more accurate Lookalike Models to predict customer churn and target users with win-back programs before they bounce. Learn more about how to reduce churn using Lytics Lookalike Models.
Maturity
Maturity is a normalized measure of how long a user has registered behavior. This indicates how "old" a customer is relative to your other users. A user who has registered behavior over 5 years will likely have high maturity. A user who registered behavior over 3 years, but hasn't registered any in 2 years will have less maturity. A user who registered behavior over the most recent 3 years will have the same maturity as the user previously mentioned.
As an example, you could target users with high maturity scores inviting them into a loyalty rewards program via ads, emails, and in-app notifications. You may also want to consider suppressing engaged users who are likely to make their next purchase without additional advertising. Low maturity users, on the other hand, could be served more onboarding or educational content to nurture them into high-value, long-term users.
Volatility
Volatility measures how stable vs. sporadic a user is interacting with your brand. It represents the stability of the volume of data that a user is generating, and serves as a slightly more nuanced version of the intensity score.
Consider a user where 100% of their daily sessions are considered "intense". Their intensity score would be 100, but the score doesn't yield any information regarding the volatility of a typical session.
Utilizing Scores
Each Lytics score is accessible as a Custom Rule in the Audience Builder. They can be added to any audience definition as an intelligent filter when the size of the audience is larger than desired.
For example, when crafting an audience to be used to buy ads against, the size of the audience is critical. The size can be arbitrarily shrunk by taking 10% of the matching users, or it can be intelligently shrunk by creating a threshold with a Lytics score such as Propensity or Momentum. This way, the best fit users remain.
Interfacing with scores directly can be difficult. They are low-level building blocks that require expertise to use to their fullest. To make these scores more readily usable, Lytics offers out-of-the-box Behavioral Audiences that use scoring under-the-hood.
Customizing Data Sources
Lytics scores work best on behavioral data — that is, data that was generated by a user, like a web view or email open, rather than on list imports or other non-behavioral data.
Every supported 3rd party integration is already configured to include only behavioral data in user scores. By default, any custom integration is assumed to be non-behavioral. If you're using a custom integration that you want to contribute to behavioral scores, contact your account manager to update the setting.
Behavioral Audiences
Since using Lytics behavioral scores directly requires a level of understanding of the data science at play, Lytics also offers out-of-the-box behavioral audiences.
These audiences are essentially blends of scores that can be used alone or as a rule in a custom audience. For example, Casual Visitors describes users who come and go without showing much activity per session. The definition using Lytics scores is Users with an intensity score less than 25. Now, instead of needing to know exactly what "intensity" means in this context, or what the significance of the number 25 is, the audience Casual Visitors can be used as a building block.
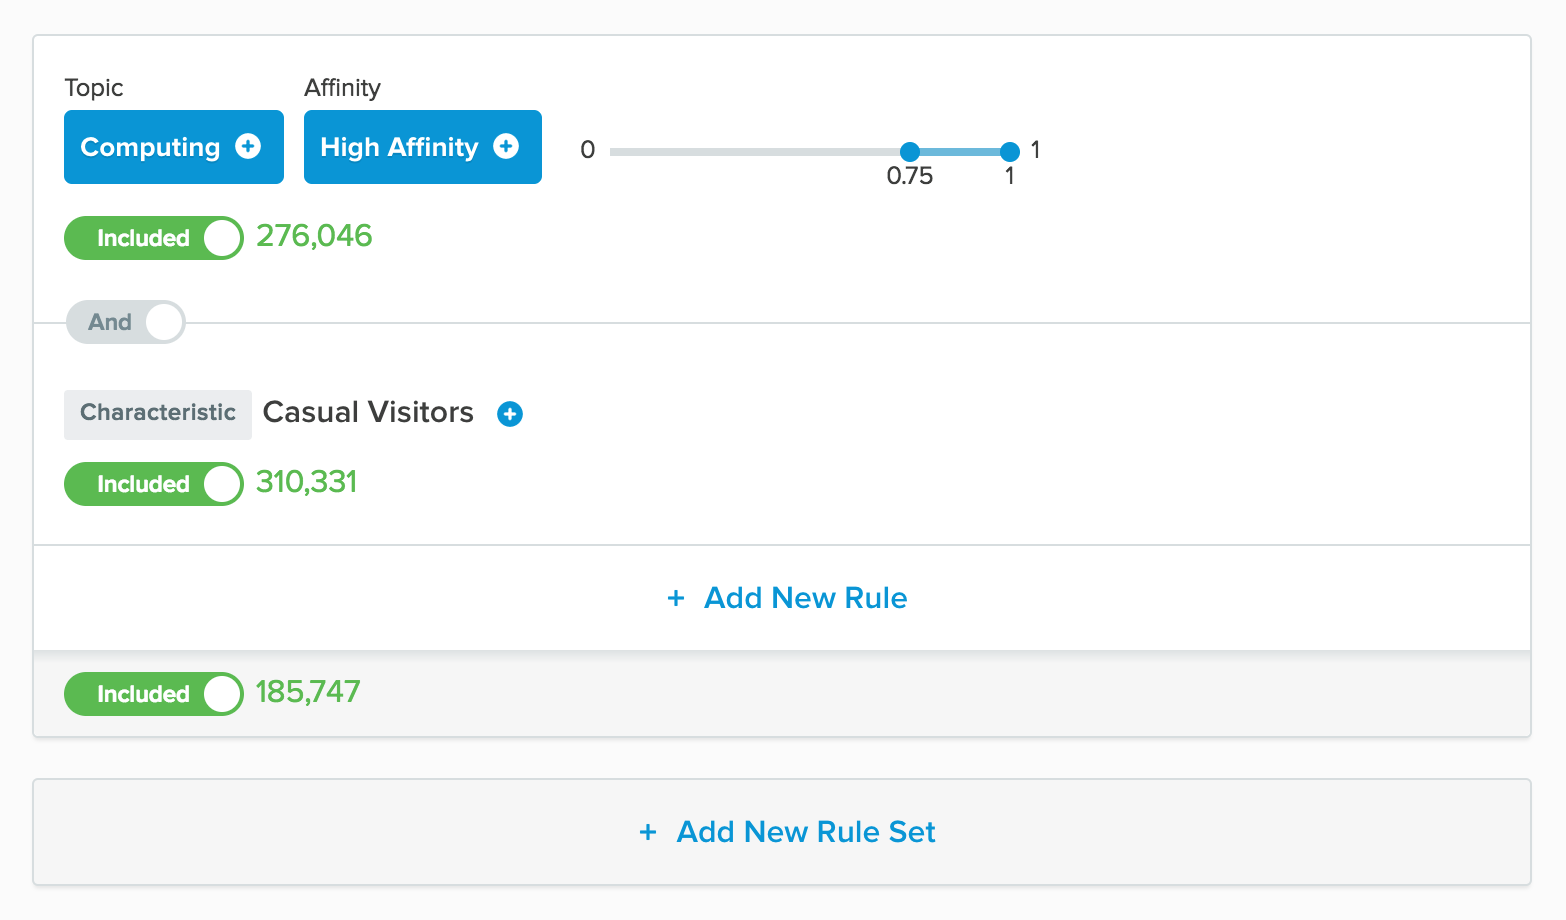
In this example audience, the Casual Visitors characteristic is being used to filter the users who have a high affinity for "Computing". Note that the number of people who have a high affinity for "Computing" is 276,046, but the number of people who have a high affinity for "Computing" and qualify as a Casual Visitor is 185,747.
Reducing the size of an audience is a great way to make a campaign more efficient. Additionally, splitting an audience based on behavioral properties is a great way to introduce different modes of communication for different archetypes of users. For instance, Casual Visitors may not stick around long enough to answer their own questions, try engaging them with a slideout on early page visits. The opposite of Casual Visitors, Deeply Engaged Visitors, are probably determined to find that information on their own and would find a popup to be annoying. Splitting the audience keeps both archetypes engaged without accidentally detering anyone.
The Full Set of Out-of-the-box Behavioral Audiences

- Frequent Users: Users who interact with your brand a lot. Definition: Frequency Score > 65.
- Infrequent Users: Users who interact with your brand occasionally. Definition: Frequency Score< 35.
- Deeply Engaged Users: Users who show a lot of activity when they do interact with your brand. Definition: Intensity Score > 75.
- Moderately Frequent Users: Users who occasionally interact with your brand. Definition: scorefrequency > 34 and score_frequency< 76.
- Casual Visitors: Users who show little activity when they do interact with your brand. Definition: Intensity Score< 25.
- Likely To Re-engage: Users likely to come back based on their past activity patterns. Definition: Propensity Score > 75.
- Unlikely To Re-engage: Users not likely to come back based on their past activity patterns. Definition: Propensity Score< 35.
- At Risk Users: Users whose interaction behavior is changing for the worse. Definition: Momentum Score >= 10 and Momentum Score<= 30.
- Binge Users: Users who show a lot of activity when they do interact with your brand. Definition: Frequency Score<= 20 and Intensity Score >= 50.
- Perusers: Users who visit often but rarely interact deeply with your brand. Definition: Frequency Score >= 70 and Intensity Score<= 20.
Lytics Behavioral Audiences
The follow out-of-the-box audiences are prefixed with "Lytics" and can be found in the Audiences list.
- Lytics New: Users who were created within the past 7 days. Definition: _created > "now-7d".
- Lytics Disengaged: Users who show minimal or no activity for a prolonged period of time. Definition: Frequency<= 5 and Intensity = 0 and Momentum = 0 and Quantity <= 3 and _created < "now-7d".
- Lytics Previously Engaged: Users who are currently disengaged with your brand, but had been previously. Definition: Momentum<= 10 and NOT Lytics Disengaged and NOT Lytics New
- Lytics Highly Engaged: Users who engage most frequently and consistently of your users. Definition: Quantity >= 50 and Frequency >= 50 and Intensity >= 25 and Momentum >= 40 and NOT Lytics New and NOT Lytics Previously Engaged.
- Lytics Currently Engaged: Users who are currently engaging with your brand. Definition: Momentum > 10 and NOT Lytics Highly Engaged and NOT Lytics Disengaged.
Taking it further
Remember that each of these out-of-the-box behavioral audiences can be recreated with the audience builder using Lytics scores user fields. Mastering Lytics scores will open up the possibility of new combinations of score thresholds that result in new behavioral audiences to be used as building blocks in campaigns.
Updated 10 months ago