

Dashboard Report
How to interpret and configure your Dashboard Report
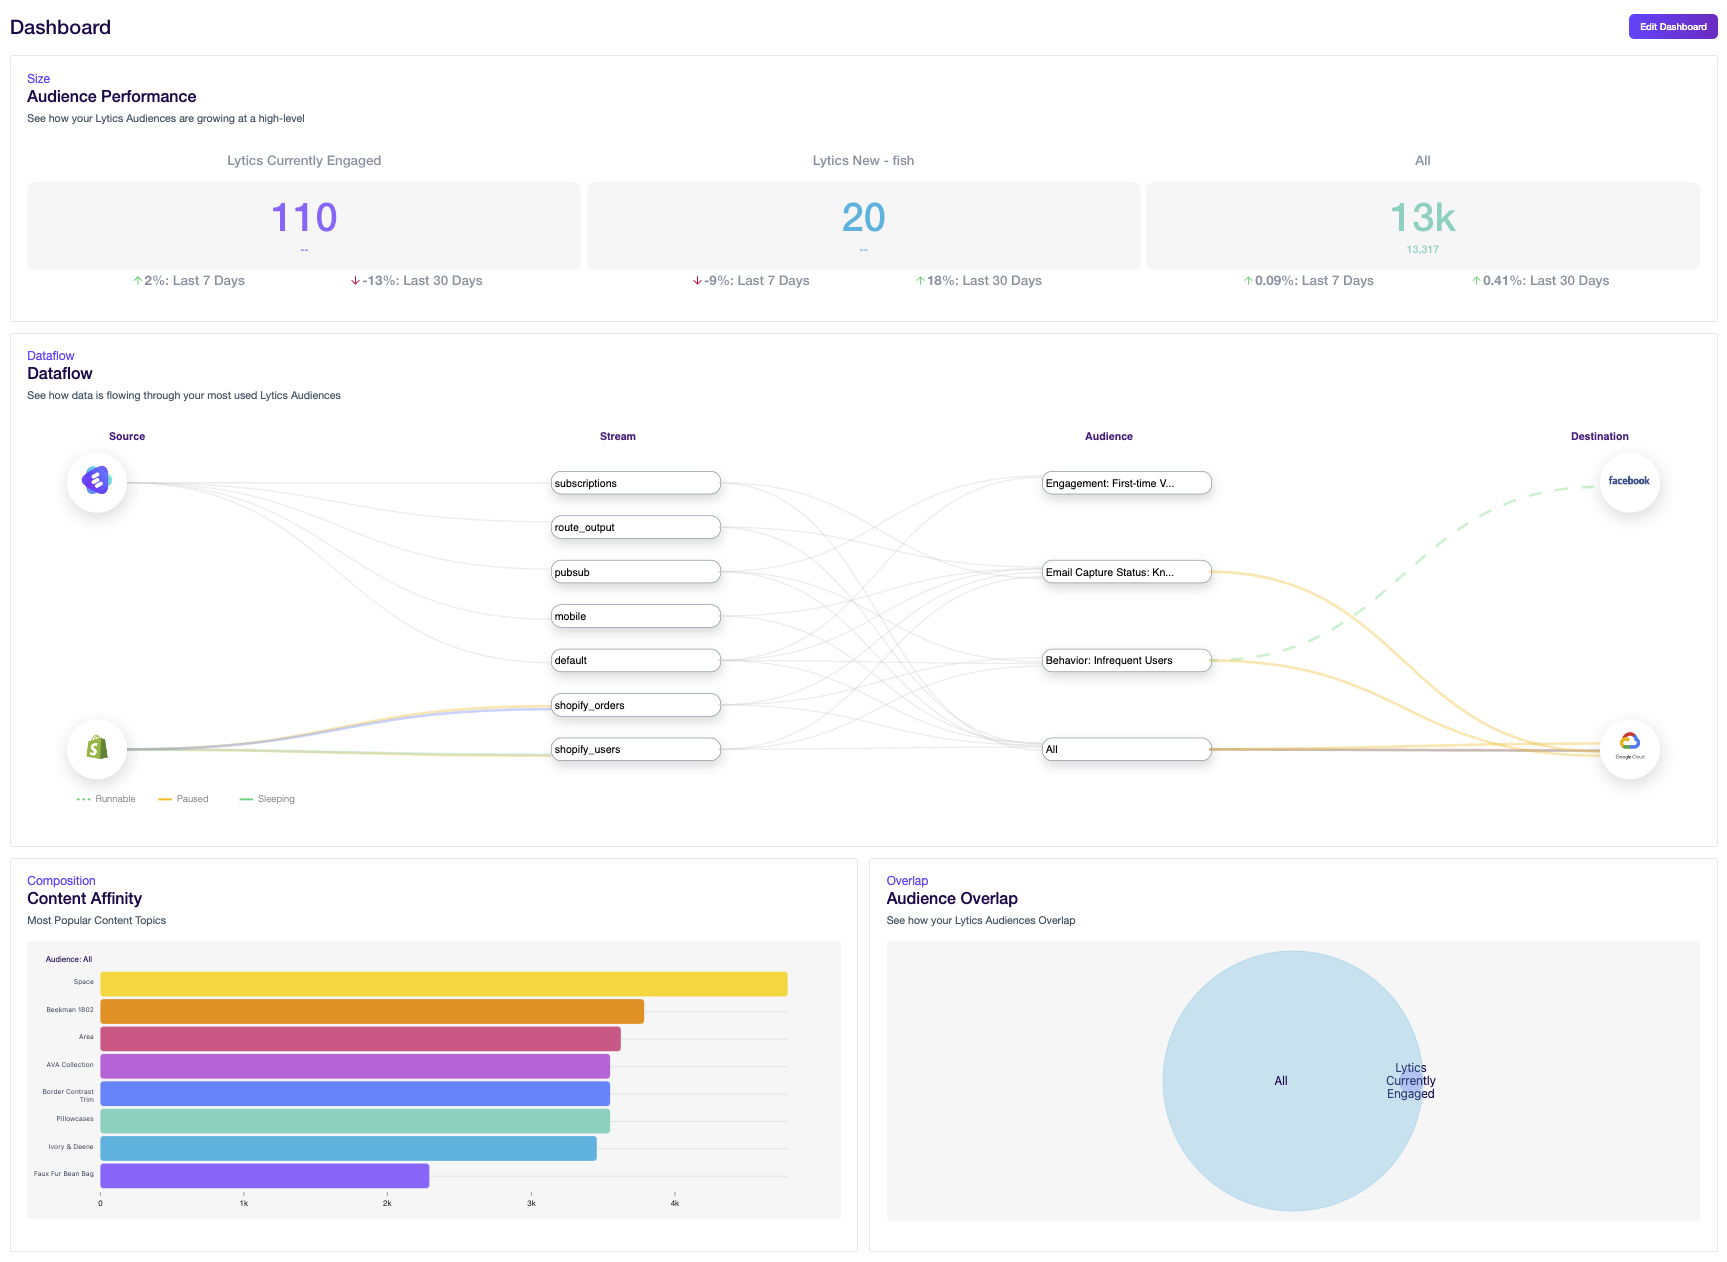
Once data is flowing into your account, Lytics will automatically generate a Dashboard Report on the homepage of the Decision Engine app. While the dashboard Report is fully customizable, the out-of-the-box Report consists of 4 Report Components that incorporate some of Lytics' Behavioral Audiences :
- Size Component of the All, Lytics New, and Lytics Highly Engaged audiences
- Dataflow Component of the 5 most "used" audiences (ie the audiences that appear in the most Jobs).
- Composition Component of Lytics' Content Affinity
- Overlap Component of the All, Lytics New and Lytics Highly Engaged audiences.
To modify or edit the Dashboard Report, simply click on the Edit Dashboard button located on the top-right corner of the page. Clicking this button will redirect you to the Report page, where you can add or delete Components, and edit existing Components.
Updated 10 months ago
Did this page help you?