

New Relic
# Overview
Export a variety of Lytics metrics for monitoring in New Relic Insights. This allows you to easily set up dashboards, alerts, thresholds, and more.
## Before you begin
Ensure you have created a New Relic account with Insights. [This tutorial](https://docs.newrelic.com/docs/insights/insights-data-sources/custom-data/send-custom-events-event-api#register) will walk you through what this integration does.
See a [full list of metrics](doc:monitoring-lytics).
> 📘
>
> The name of the metrics listed in metrics doc will have a prefix value of _lytics\_\_ in front of each \_eventType_.
# Authentication
To use write metrics to New Relic Insights, you will need an API key.
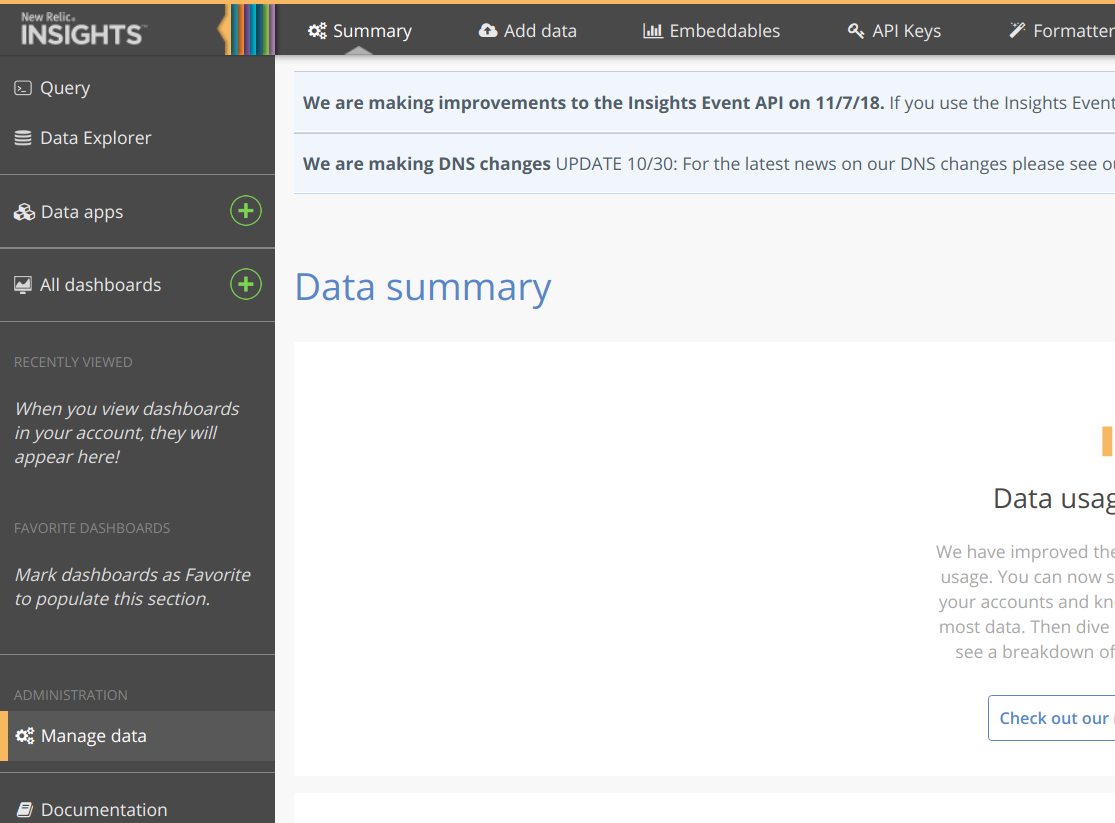
1. In the New Relic console under **Insights** select **Manage Data**.
2. Click Top Nav Tap **API Keys**.
3. Enter the details for your new API key and click **Create**.
4. In Lytics, navigate to the New Relic integration in integrations.

5. Click **Export Monitoring Metrics** and then **Add new Authorization**.
6. Paste your New Relic API key into the **Insights API Key** textbox. Also enter a description for the authorization in the **Description** box.
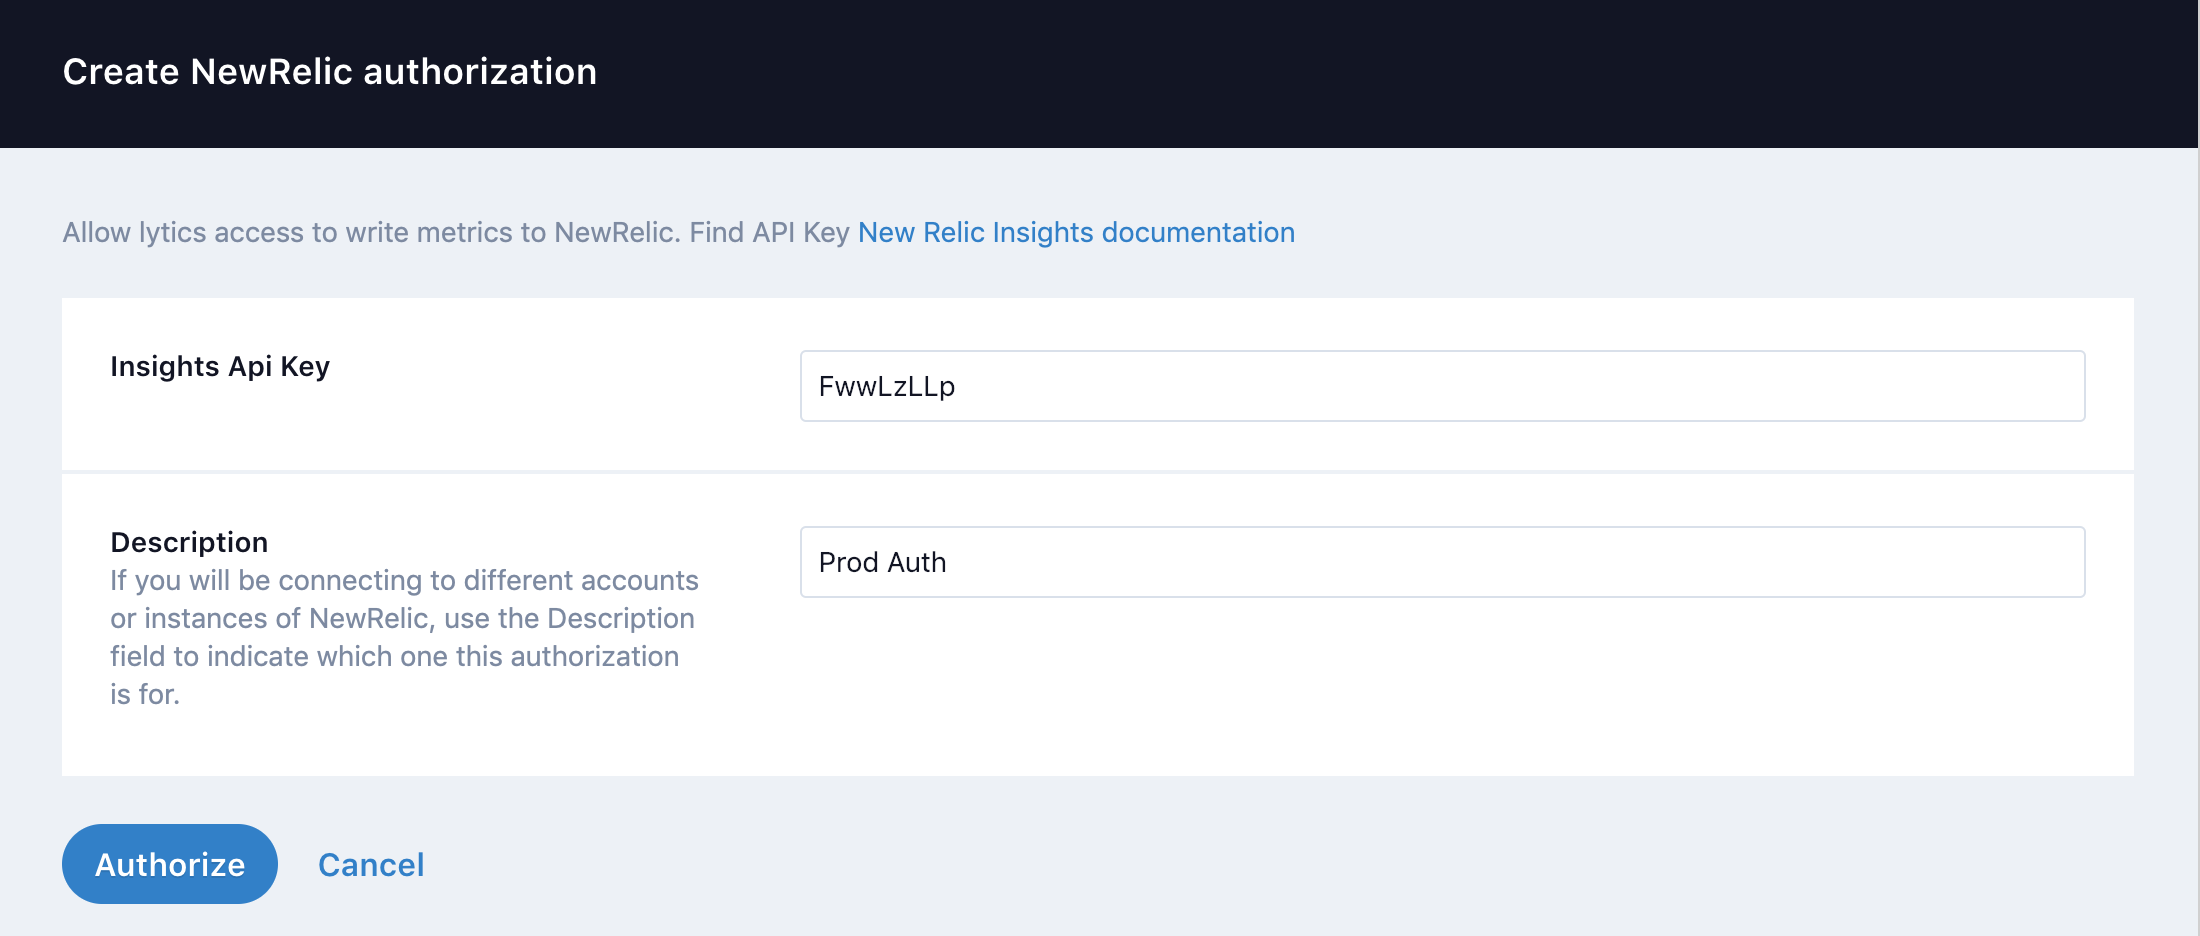
7. Click **Authorize** to save the credentials.
# Export Metrics to New Relic Insights
| Summary | |
| ---------- | ----------------------------------------- |
| Frequency | Metrics are written out every 60 seconds. |
| Exports to | Insights Custom Events |
You can choose to export incoming events metrics, audience change metrics, or user metrics to Insights for alerting and monitoring.
> 📘
>
> The name of the metrics listed in metrics doc will have a prefix value of _lytics\_\_ in front of each \_eventType_.
Example:
```json
[
{
"eventType": "lytics_monitoring_heartbeat",
"eventSource": "LyticsMonitoring",
"eventTime": "2006-01-02T15:04:05Z07:00",
"account":"test123",
"value": 1
}
]-
In Lytics, navigate to the New Relic integration in integrations.
-
Click Export Monitoring Metrics.
-
Select the authorization you created in the authorization step.
-
In the New Relic Account ID textbox, enter the ID of your account. You can get this ID from the URL of "Account Settings" in New Relic.
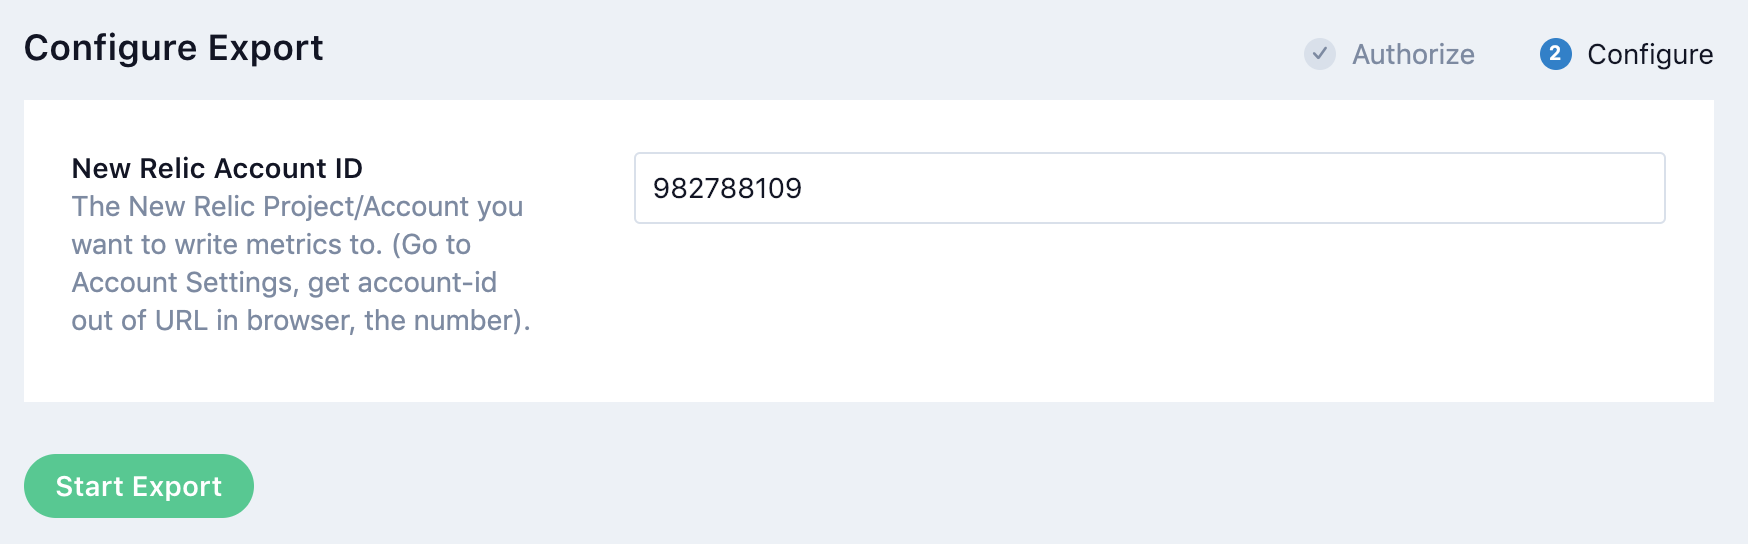
-
Click Start Export.

You should see metrics coming in as custom events into your Insights account after setting up this integration.

Alerting Examples
Once the export has started and some data has been collected on the New Relic side, you can use the data to create alerts within New Relic.
For instance, using the Lytics Monitoring Heartbeat metric, you can create an alert if the service happens to be interrupted. The following alert(s) are just examples, Lytics recommend building in some buffers so alerts don't begin to go off for simple network issues. In this case we'll issue a warning if the query returns less than 1 for 5 minutes and a full alert if we see less than 1 for 15 minutes.
NRQL> SELECT count(value) FROM lytics_monitoring_heartbeat
 lytics_monitoring_heartbeat query result is < 1 unit for at least 15 mins
 lytics_monitoring_heartbeat query result is < 1 unit for at least 5 mins
We could also create an alert to watch traffic collection which may tell us if there is an issue with the JavaScript tag on a production website. In this case if the value of collection counts falls below one, we know no data is coming into any stream so there is likely an issue.
NRQL> SELECT average(value) FROM lytics_collection_count
 lytics_collection_count query result is < 1 unit for at least 40 mins
 lytics_collection_count query result is < 1 unit for at least 20 mins
Updated 11 months ago