

Metrics
Understanding how your flows are performing is crucial for optimization and success. This guide covers all available metrics, monitoring capabilities, and how to interpret flow performance data.
Overview
Flows provide comprehensive metrics at multiple levels to help you understand user behavior and flow performance.
Metrics Update Frequency
Important Note: All flow metrics are calculated once every 24 hours, not in real-time. This means:
- You won't see instant changes when testing
- Metrics reflect data from the previous day
- Allow 24 hours for accurate reporting after flow changes
Canvas-Level Metrics
The main flow canvas provides high-level performance indicators for your entire flow.
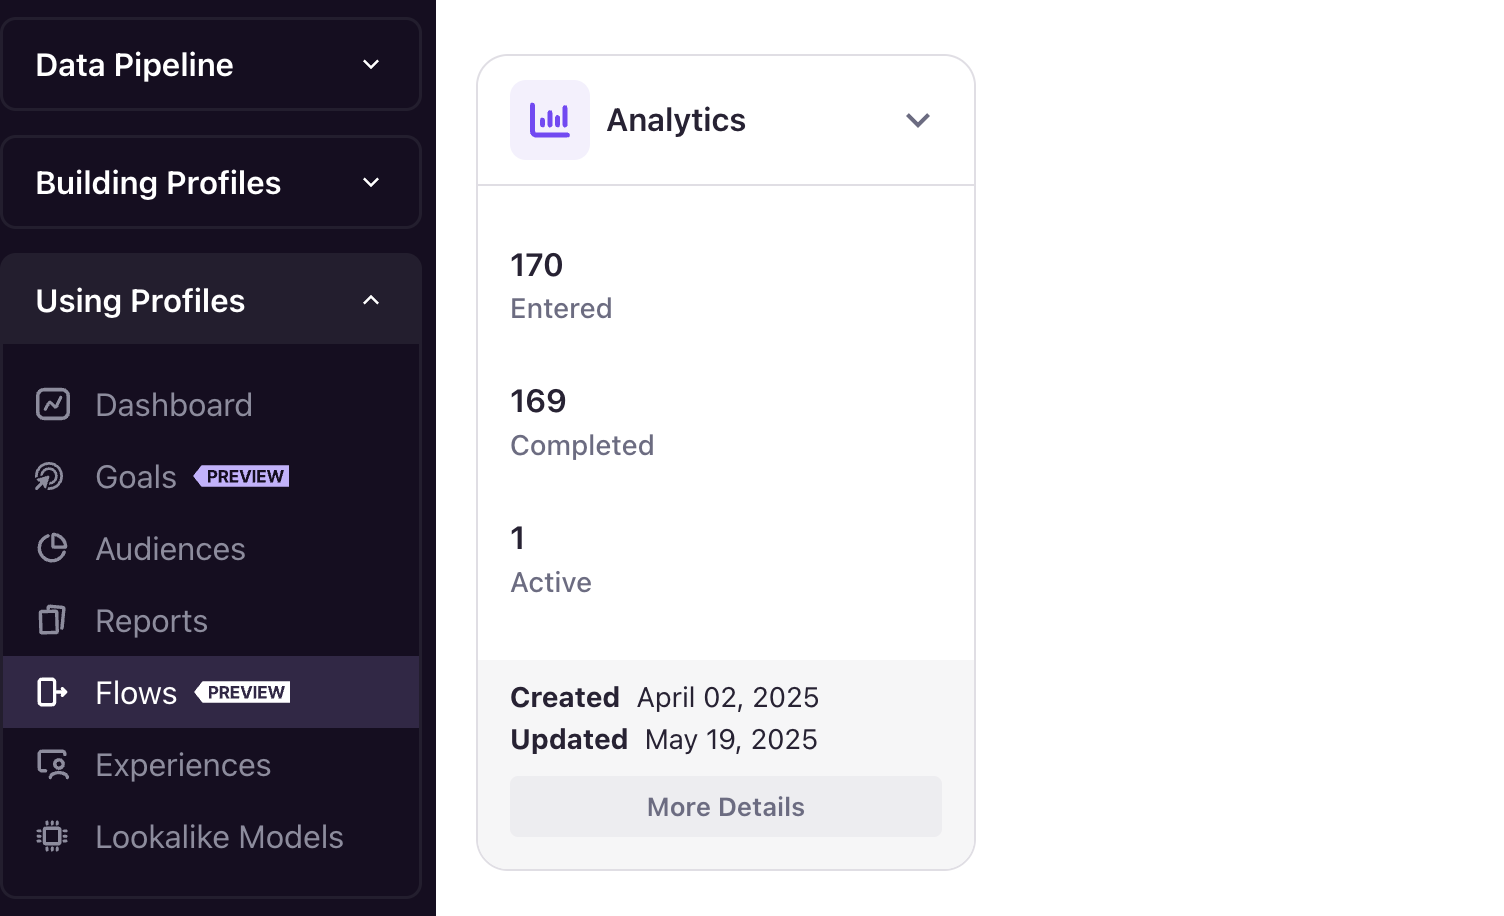
Key Canvas Metrics
Total Entries:
- Total number of users who have ever entered this flow
- Cumulative count across all time periods
Total Completed:
- Number of users who have reached the end of the flow
- Users who progressed through all configured steps
- Indicates successful flow completion
Currently In Flow:
- Number of users actively progressing through steps
- Users currently in wait states or pending actions
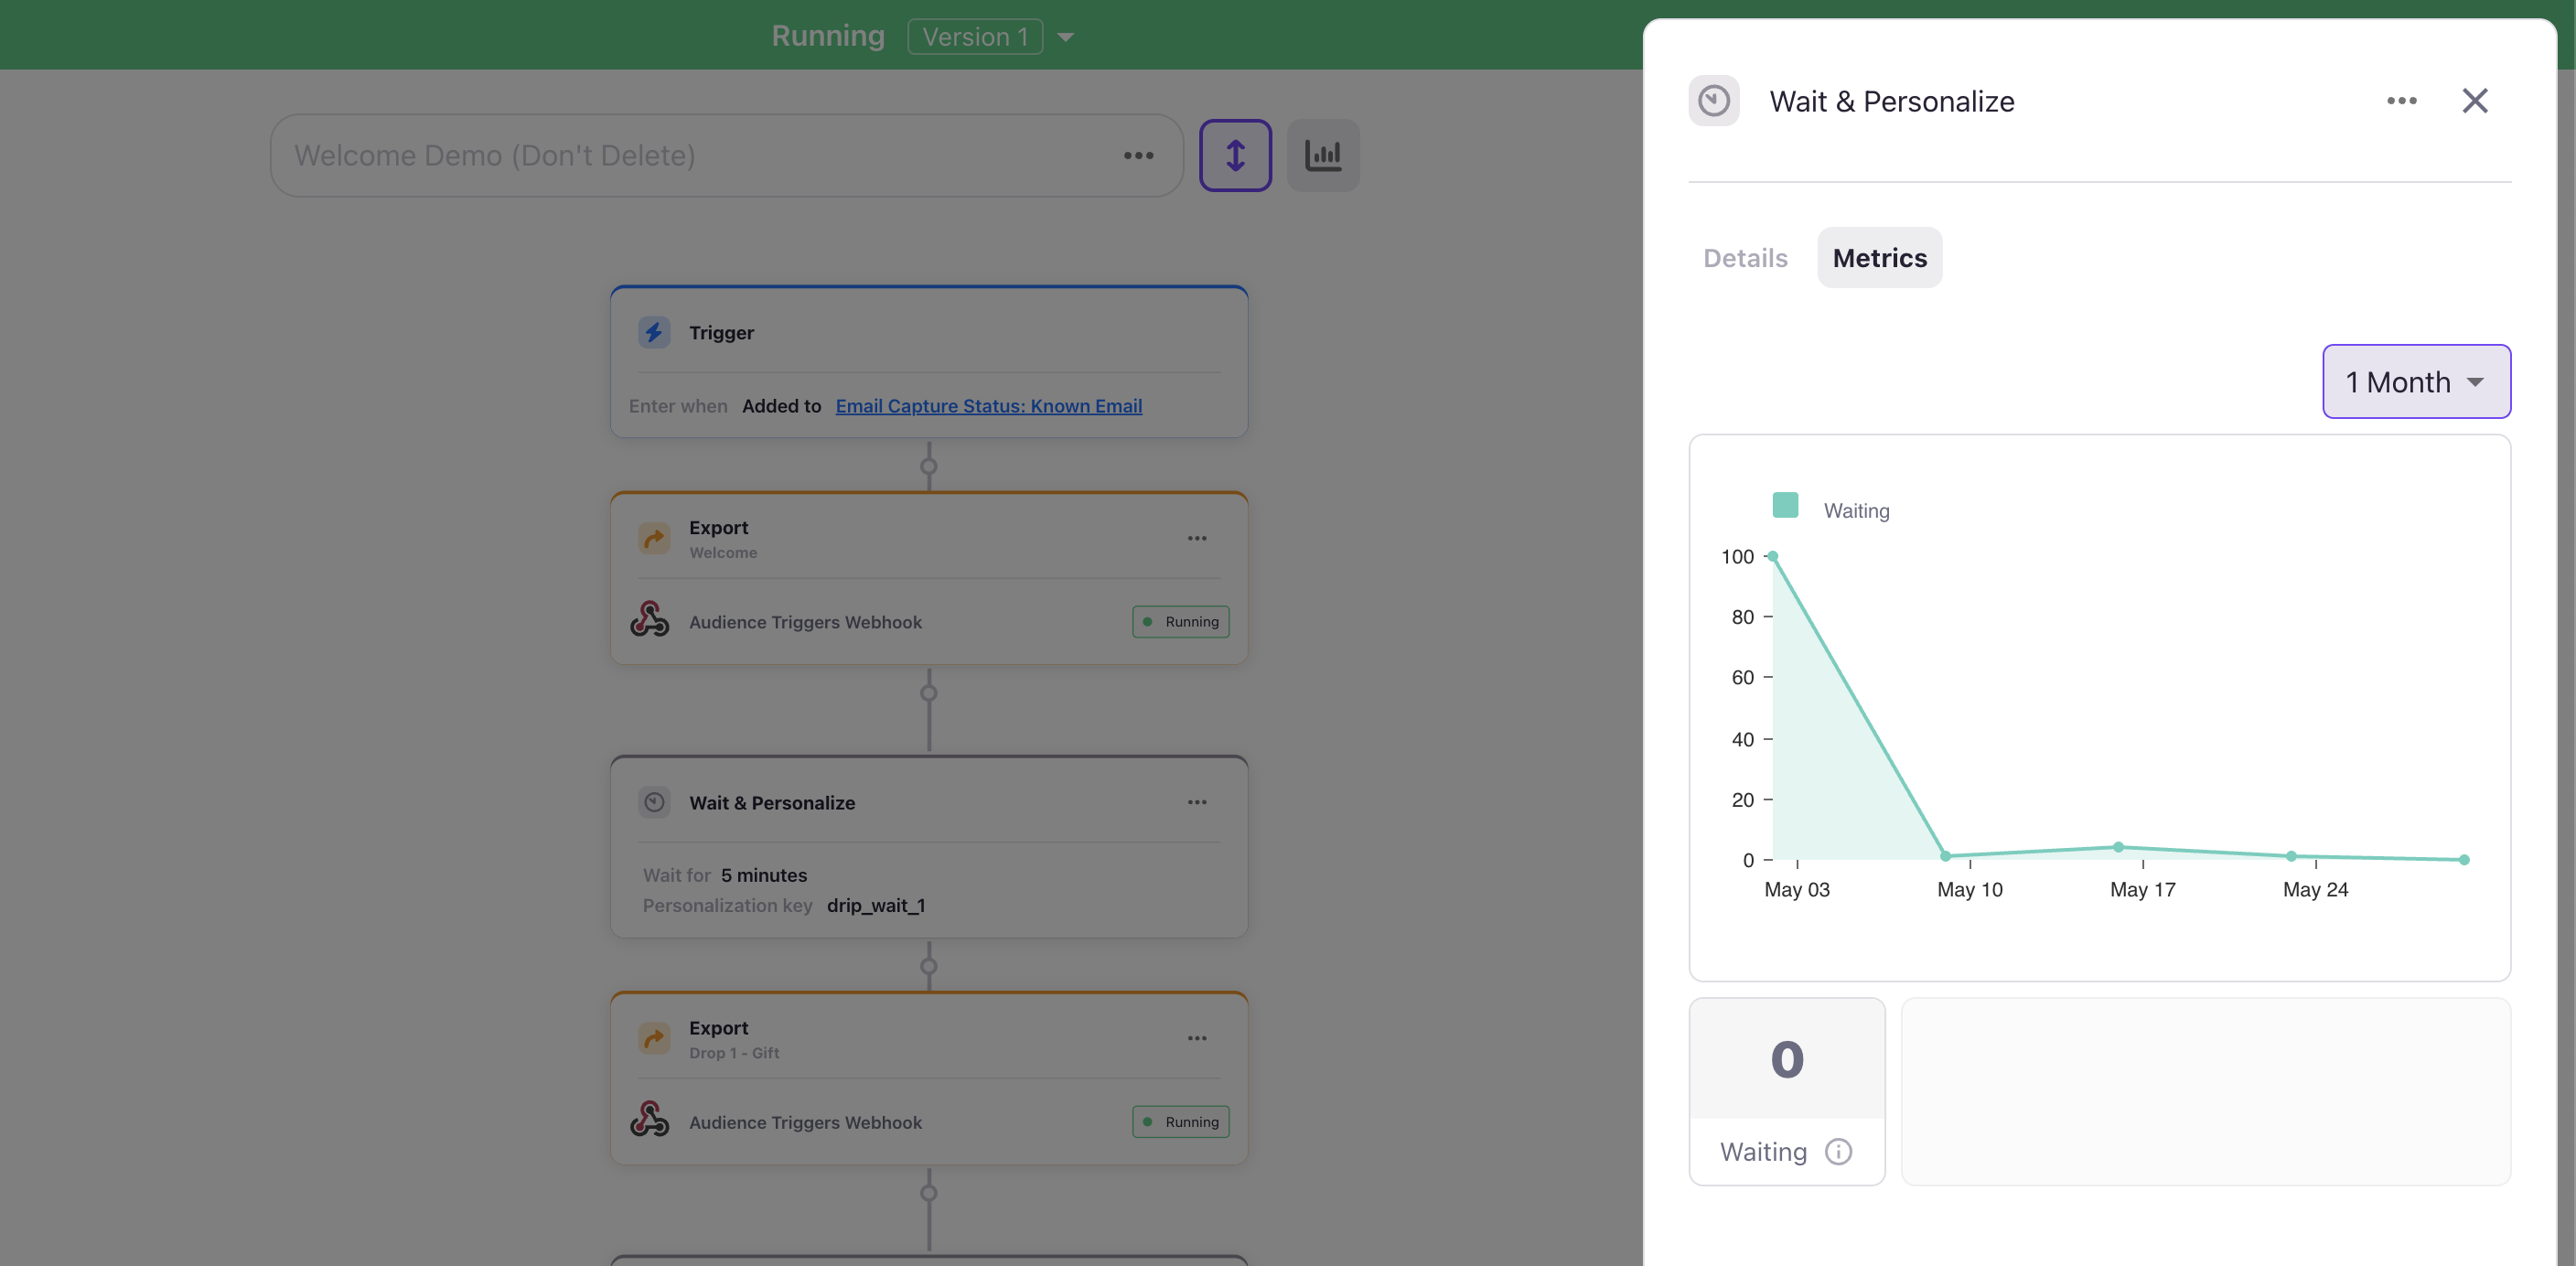
Canvas Metrics Display
Access canvas metrics by:
- Opening the metrics panel at the top of the canvas
- Expanding the metrics section to see detailed breakdown
- Viewing metrics snapshot on individual step cards
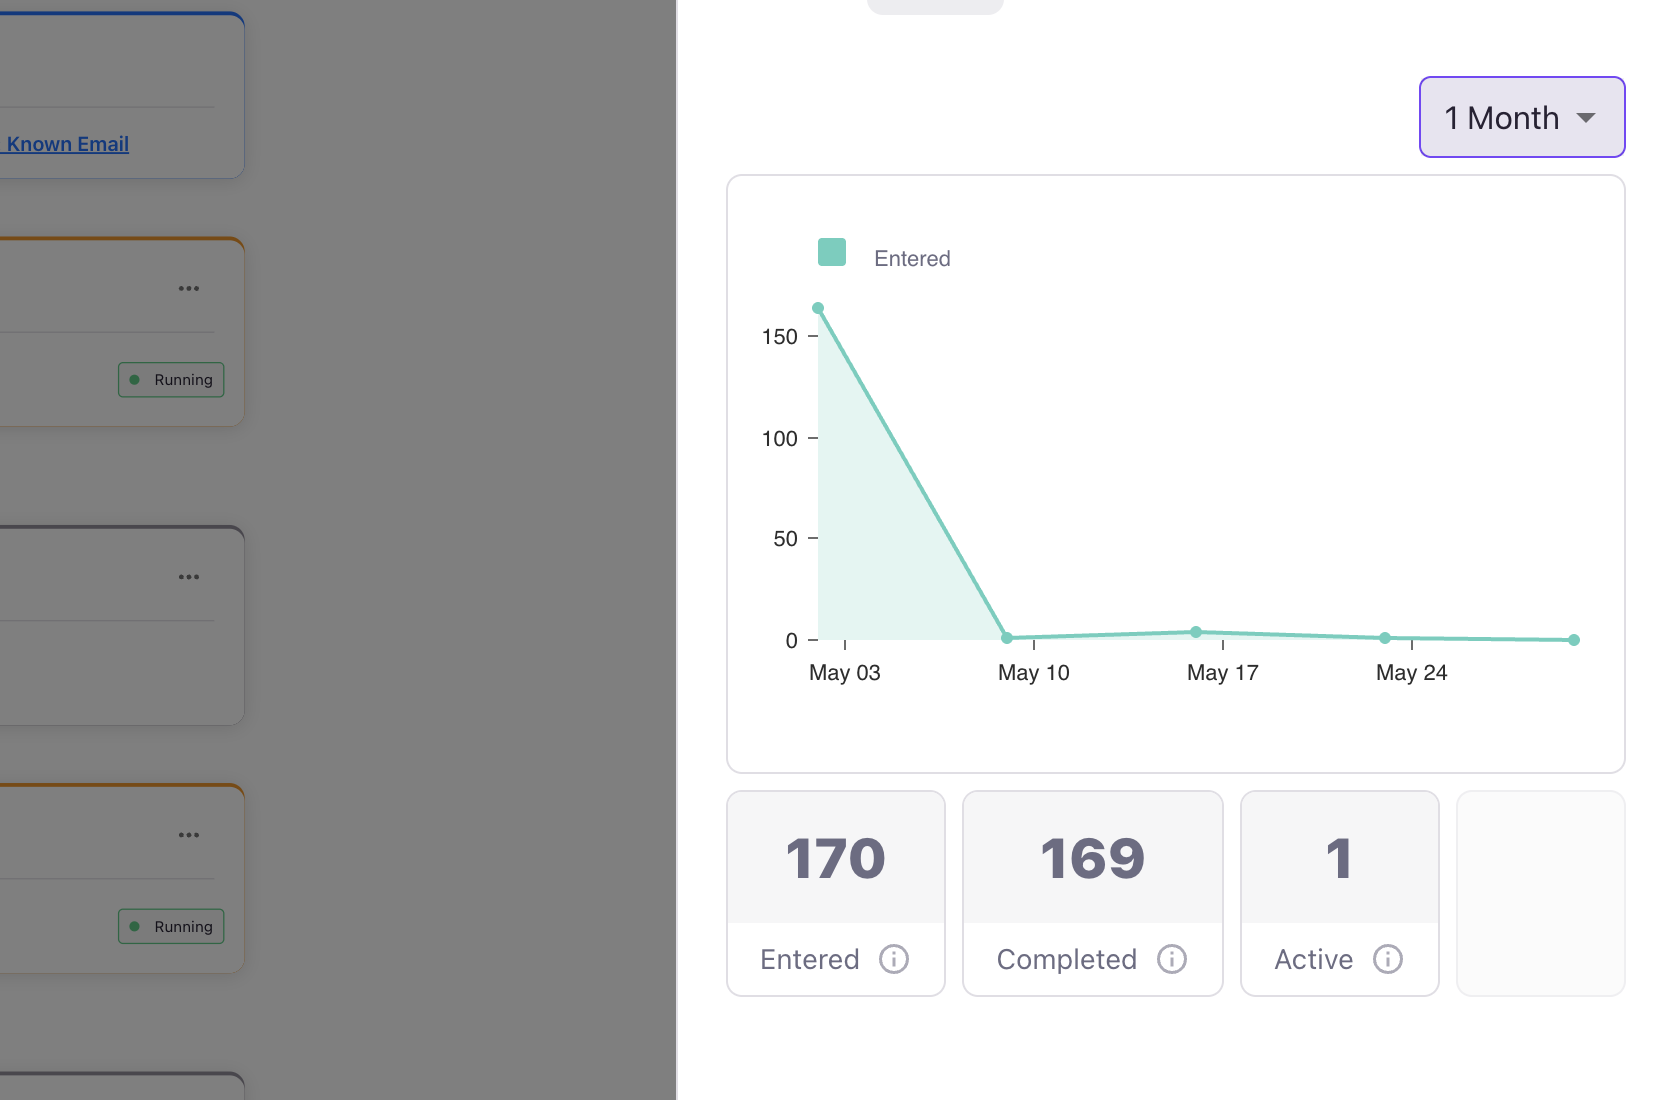
Detailed Metrics View
Each step offers a comprehensive metrics breakdown with historical data and trends.
Historical Data
Time Period Selection:
- Daily breakdown: See activity by specific days
- Weekly view: Understand weekly patterns
Profile-Level Flow Tracking
Individual user profiles show detailed flow state information, enabling personalized experiences and troubleshooting.

Flow State on Profiles
Flow Steps Array:
- Shows current position in all active flows
- Includes personalization keys from wait steps
- Updates in real-time as users progress
- Available through JavaScript and APIs
Next Steps
With a solid understanding of metrics:
- Explore Templates for proven flow patterns
Updated 10 months ago