

Topic Taxonomy
Topic Taxonomy
Using data science techniques to look at the topic overlap between classified content, Lytics will programmatically build a topic taxonomy. In addition to programmatically building this taxonomy, Lytics dynamically adjusts the taxonomy as new content gets published.
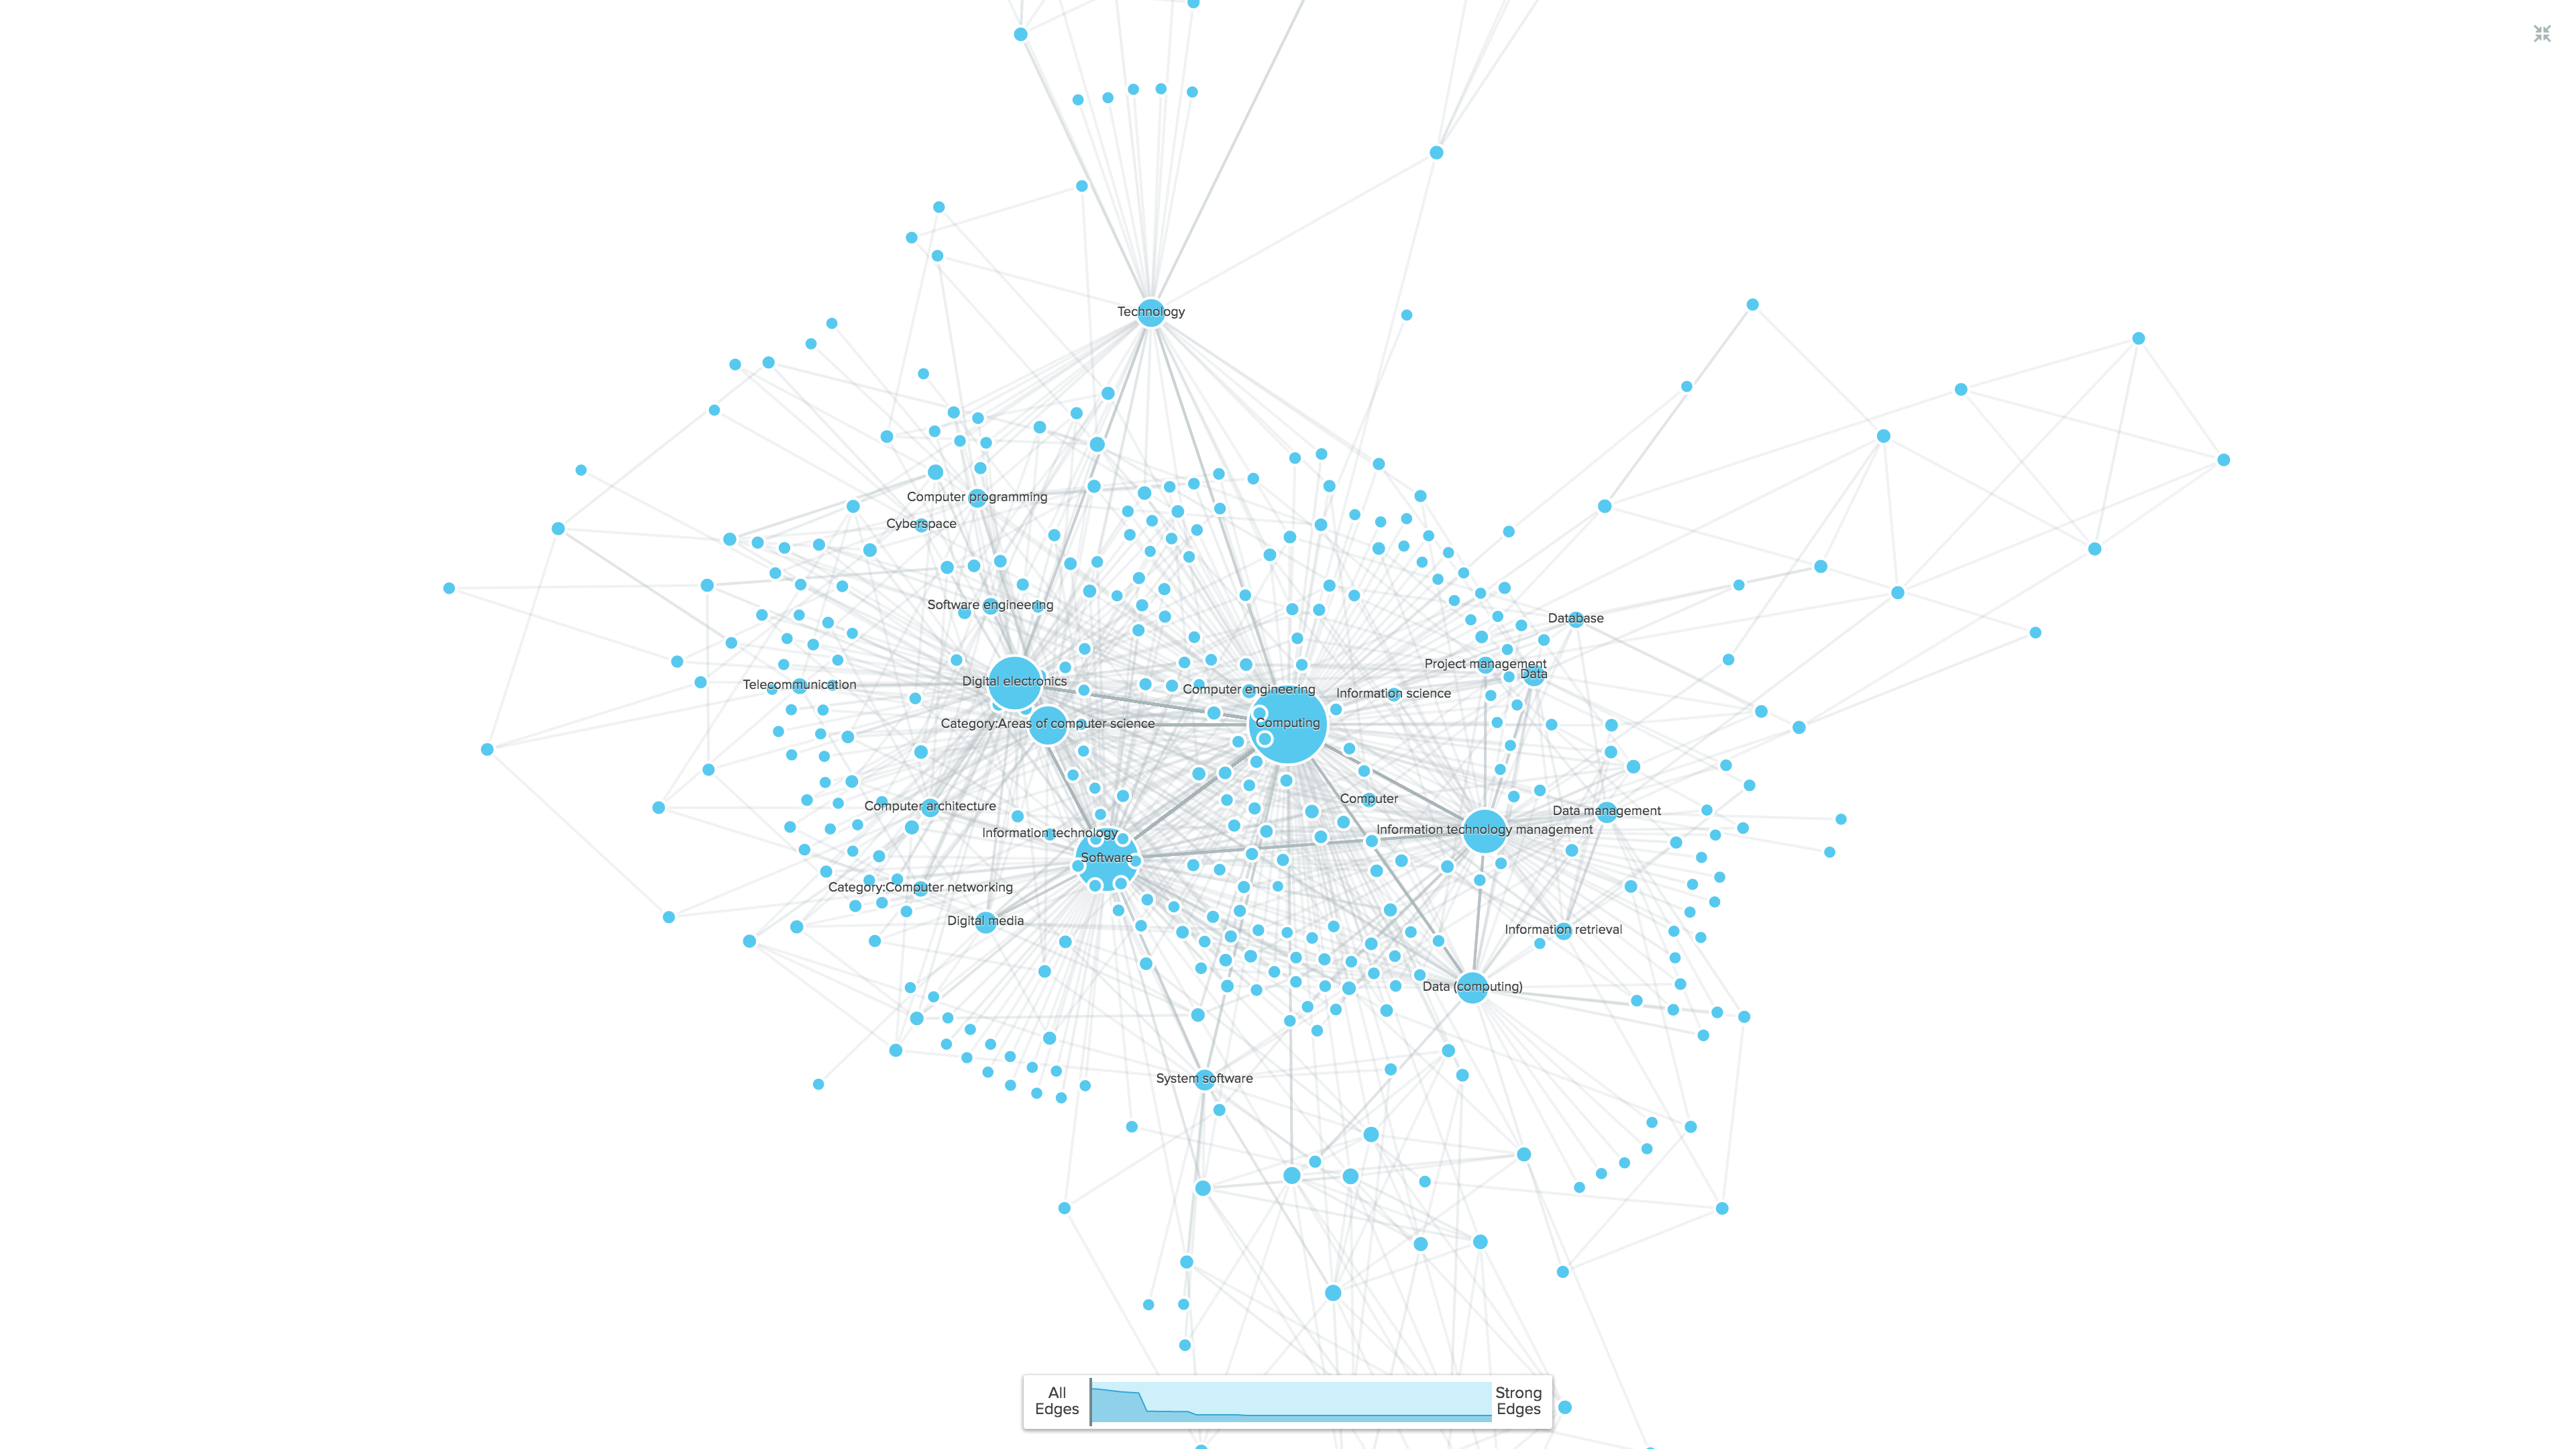
The topic taxonomy is stored as a weighted and directional graph. Although this structure may be daunting to look at—and even more daunting to try and utilize by hand—Lytics uses it when determining content recommendations.
Topic Relationships
Topics are determined to be related by evaluating how they occur together and how they occur independently. When two topics occur together frequently (meaning in multiple documents), it is safe to assume they are related. In addition to the relationship existing, Lytics will determine the direction of the relationship. Is "Cookies" a subtopic of "Baking" or is "Baking" a subtopic of "Cookies"?
The co-occurrence of topics determines the relationship. The independent occurrence of a topic determines the direction. Since the topic "Cookies" frequently occurs with "Baking," but "Baking" frequently occurs without "Cookies," "Cookies" must be a subtopic of "Cookies." To draw this example further, "Baking" may be a subtopic of "Recipes," "Recipes" may be a subtopic of "Cooking," and "Cooking" may be a subtopic of "Hobbies."
This is important because it allows Lytics to make affinity inferences. A user with a high affinity for "Cookies" may be interested in general "Baking" content.
Weighting Relationships
The weight between relationships is incredibly important to consider when making affinity inferences. For instance, Michael Jordan played baseball professionally for one dark year in the 90s. This means there are valid relationships between Michael Jordan and Baseball and Michael Jordan and Basketball. Most people who know anything about sports or pop culture know Michael Jordan as a basketball icon. The way this gets reflected in taxonomy is through relationship weights. The weight between Michael Jordan and Basketball is strong, while the weight between Michael Jordan and Baseball is weak.
By having weights, affinity inferences can use those weights as thresholds for building further relationships or recommending content. A user who has shown interest in Michael Jordan is more likely to be interested in Basketball than they are to be interested in Baseball. Unless they are interested in Sports Icons From The 90s, they might be more interested in Ken Griffey Jr. A rich topic taxonomy will surface this nuanced information.
The Graph Representation of the Taxonomy
A graph is the ideal data structure for topic taxonomies and taxonomies in general. Since each topic can have many subtopics and be the subtopic of many things, the correct way to structure this data is with a graph.
Leaders in data modeling use this approach. Notable examples are Facebook's Social Graph and Google's Knowledge Graph.
Updated 11 months ago