

Planning & Troubleshooting
Schema Visualization
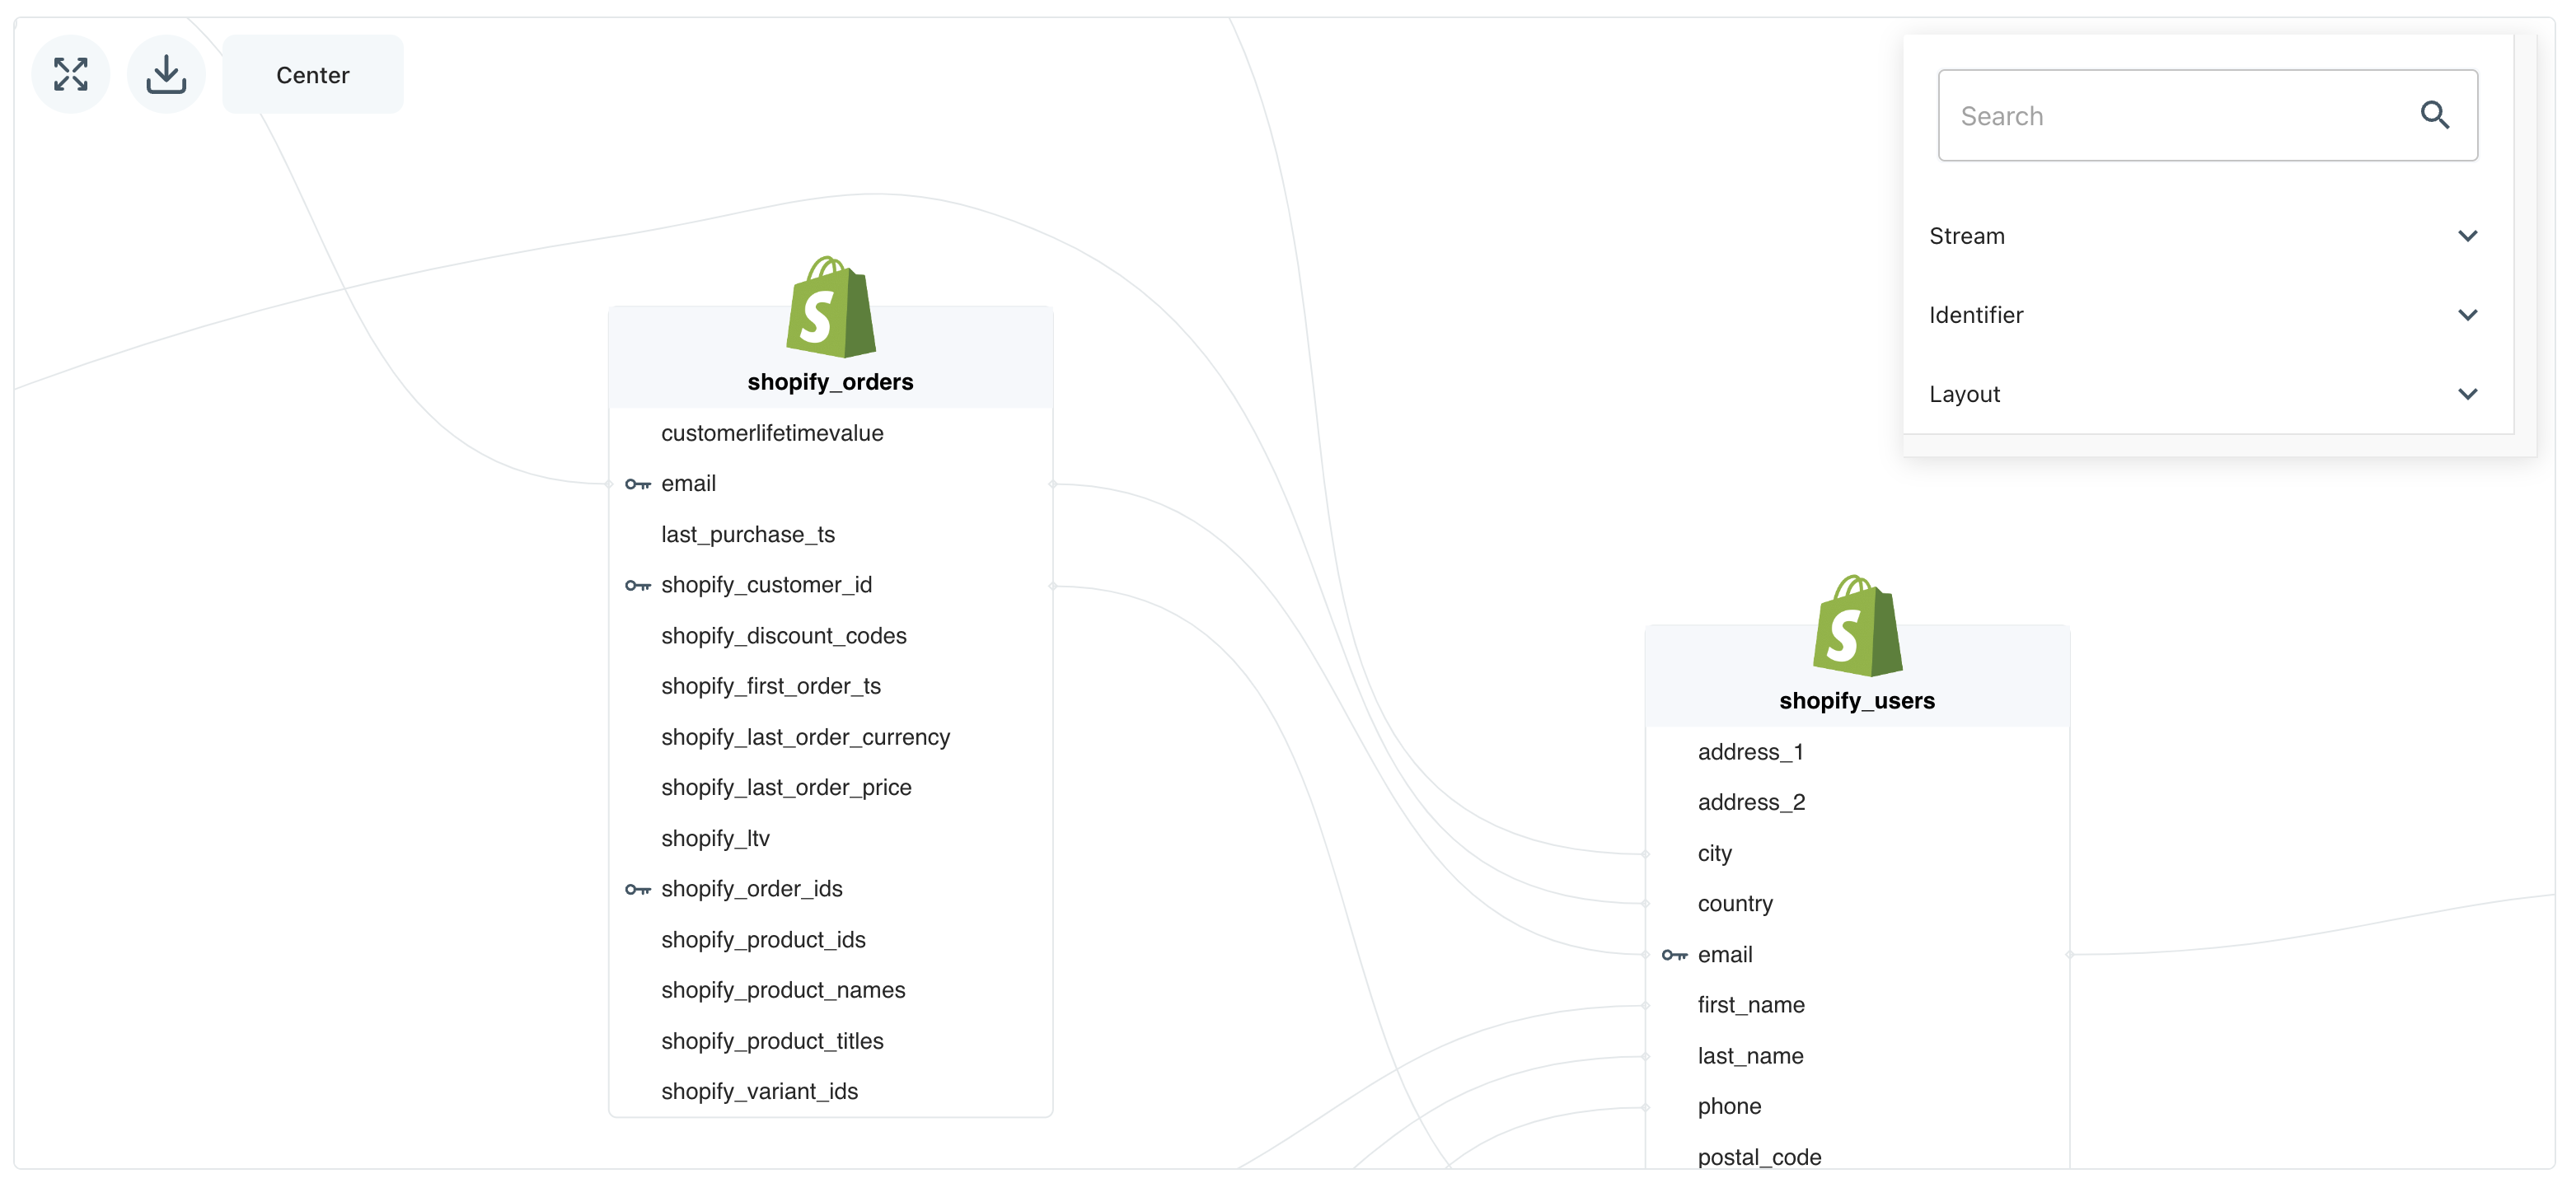
The Lytics schema visualization tool lets users visualize the relationships between data fields and data sources within the Lytics platform. The visualization provides a graphical representation of the data schema, making it easier for users to understand the structure of their data and how it is connected.
With the schema visualization, users can:
- Explore data relationships: The visualization lets users see how different data fields and sources are connected, providing a clear picture of the overall data schema.
- Identify data gaps: Users can quickly identify gaps in their data by looking for missing fields or disconnected data sources.
- Plan data integrations: The visualization can help users plan data integrations by providing a visual representation of how data from different sources can be connected.
- Troubleshoot data issues: The visualization can be used to troubleshoot data issues by identifying inconsistencies or errors in the data schema.
Overall, the Lytics schema visualization provides a powerful tool for understanding the data structure within the Lytics platform, enabling users to gain deeper insights and make more informed decisions about their data strategy.
Schema Audit
The Schema Audit provides an overview of how your user fields are being used, the data they contain, and where they are getting that data. It is a great way to see if you have user fields that don't have any data or are not being used for any audience.
On your Lytics dashboard, navigate to Data > Schema Audit. This section offers a snapshot of your data to verify your data mapping techniques.
Filtering the Schema Audit
By default, the Schema Audit includes all user fields in your account. You can filter the report in three different ways.

-
Users with field allows you to filter fields based the percentage of users in your account who have a user field. For example, if you choose At least 50%, the Schema Audit will be filtered to include only user fields found on 50% or more of the profiles in your account.
-
Data stream allows you to filter the Schema Audit based on the data source of a user field. Remember that a user field may receive data from multiple data streams.
-
Search box allows you to search for a specific user field by name.
Interpreting Data Visualizations
The visualizations near the top of the report tell you how user fields are used in your Lytics account. You can click on one of the visualizations to filter the table below.

The first pie chart shows the percentage of user fields that are providing data to build profiles from. In the example above, only 40% of user fields provide data to profiles. That means the other 60% of user fields have no data at all. This number should be as close to 100% as possible.
The second pie chart shows the percentage of user fields that are being used to define audiences. In this example, 94% of user fields are not being used to define any audience. This account probably mapped too much data, and could trim down their LQL quite a bit.
The third pie chart shows how many user fields are merging data from multiple streams. A common example of merging data from multiple streams is an email user field. Typically, this may read data from your website as well as an email tool. One of Lytics' core competencies is merging data from different sources, so be sure to take advantage of this when creating your user fields.
The distribution bar along the bottom of this section shows you what type of user fields are in your account. Certain types of user fields, especially any containing map, are more expensive and should be used carefully. Mouse over the slices of the distribution bar to see how many user fields of each type are in your account.
User Fields Table

Browse the table to find detailed information about a specific user field. Select the List audiences each field uses checkbox to expand the table and see any audience that contains a user field in its definition.
| Column | Description |
|---|---|
| ID | Slug for a user field |
| Name | User friendly name for a user field |
| Type | Data type contained in the user field |
| Sources | Streams that the user field reads data from |
| Users with field | Number of user profiles with data from this user field |
| Approx. Cardinality | Number of unique values in this user field |
| Times used | Number of times this user field is used to define an audience |
Updated 11 months ago