

Connecting Warehouses
Access
Cloud Connect tabs are found under Data Pipeline > Cloud Connect. Connections configure the access to your data warehouses, and Data Models configure the SQL queries that are run to connect audience membership and profile attributes.
Creating a Connection
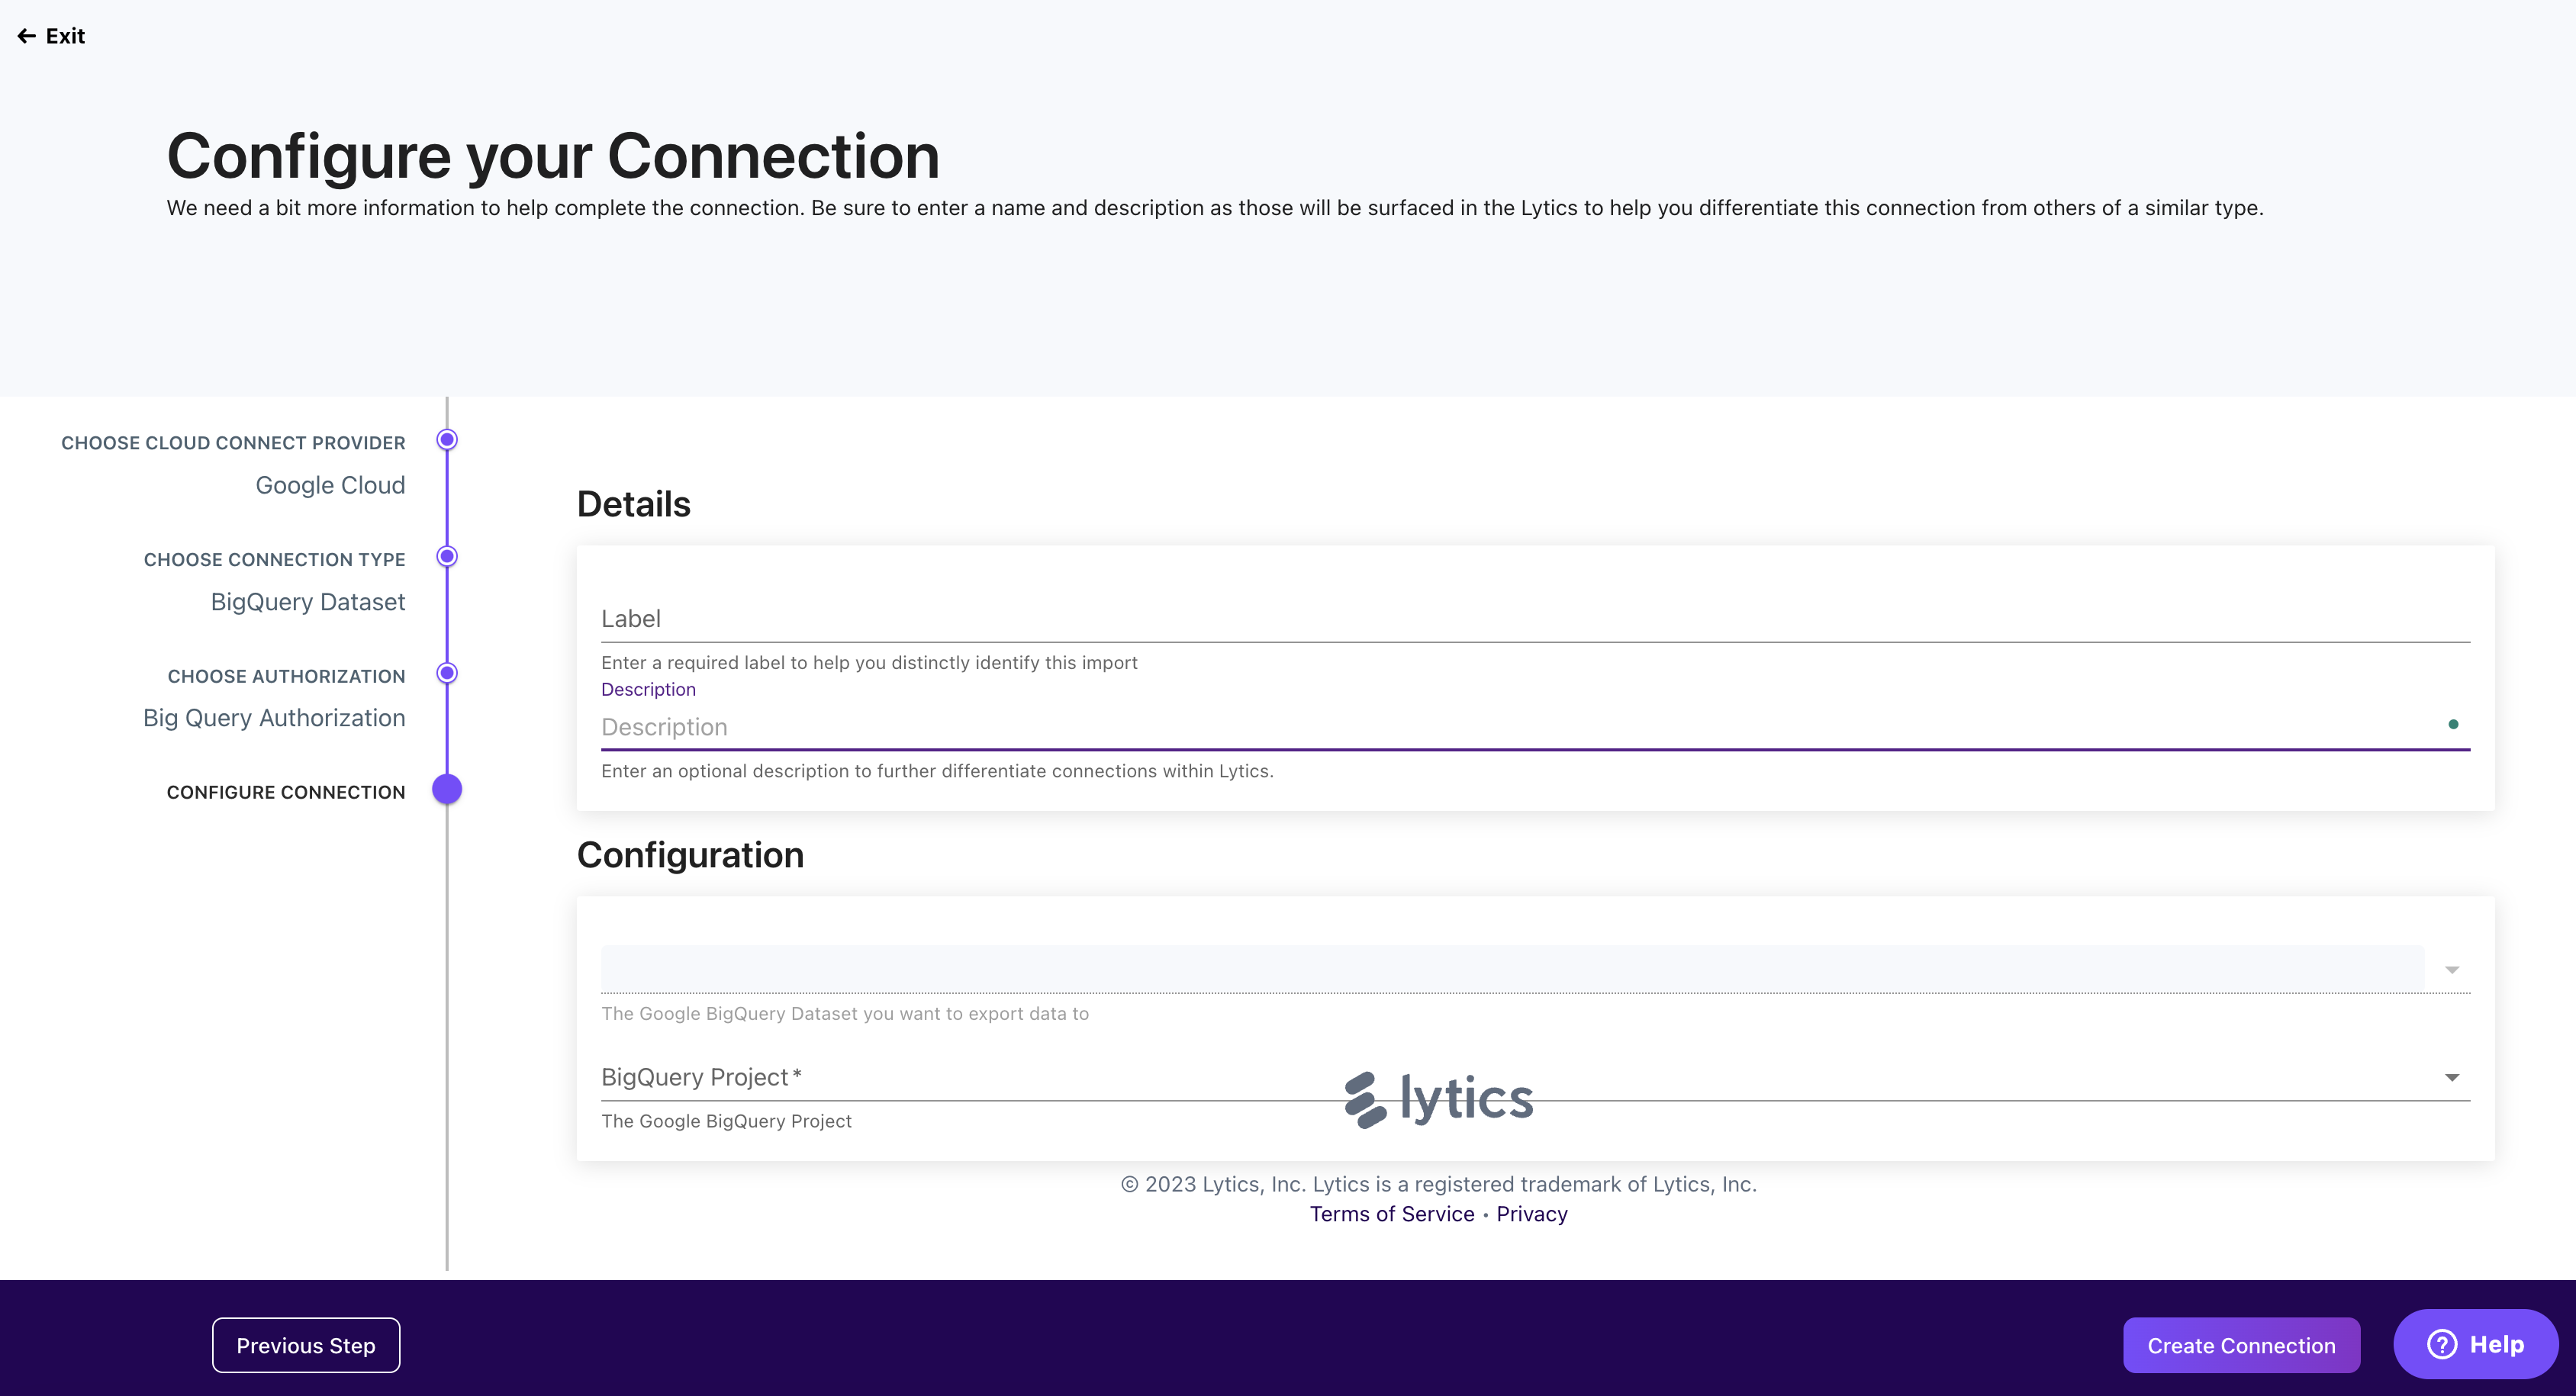
Click + Create New Connection from the Connections Dashboard at the top right and complete the following steps.
- Choose the provider.
- Choose the Connection type.
- Select an existing Authorization or create a new one by following the Authorization instructions.
- Add a name (label), description, and complete the configuration options. These will vary slightly between providers.
Authorization & Security
The authorization selected for your Connection will control your Lytics account users' access to your data warehouse. You can control whether a user has read access to the entire dataset or individual tables, maintaining your security and governance practices within your data warehouse.
Supported Data Warehouses
Cloud Connect currently supports a number of popular data warehouses:
- Amazon Redshift
- Databricks
- Google BigQuery
- Microsoft Azure SQL Database
- Snowflake
Managing Connections
Once you have created a Connection, you can access a summary page showing how data from your data warehouse is being leveraged in Lytics. At the top of the page, you’ll see the following information:
- Provider: Data warehouse that you are connecting with Lytics.
- Authorization: Name of the authorization, such as “Cloud Connect JWT.” Note: Lytics users can access any data tables that the Connection Authorization has read access to.
- Type: Indicates the type based on your provider.
- Created By: Lytics user who created the Connection.
- Created On: Date the Connection was initially created.
- Last Updated: Date the Connection was most recently edited.
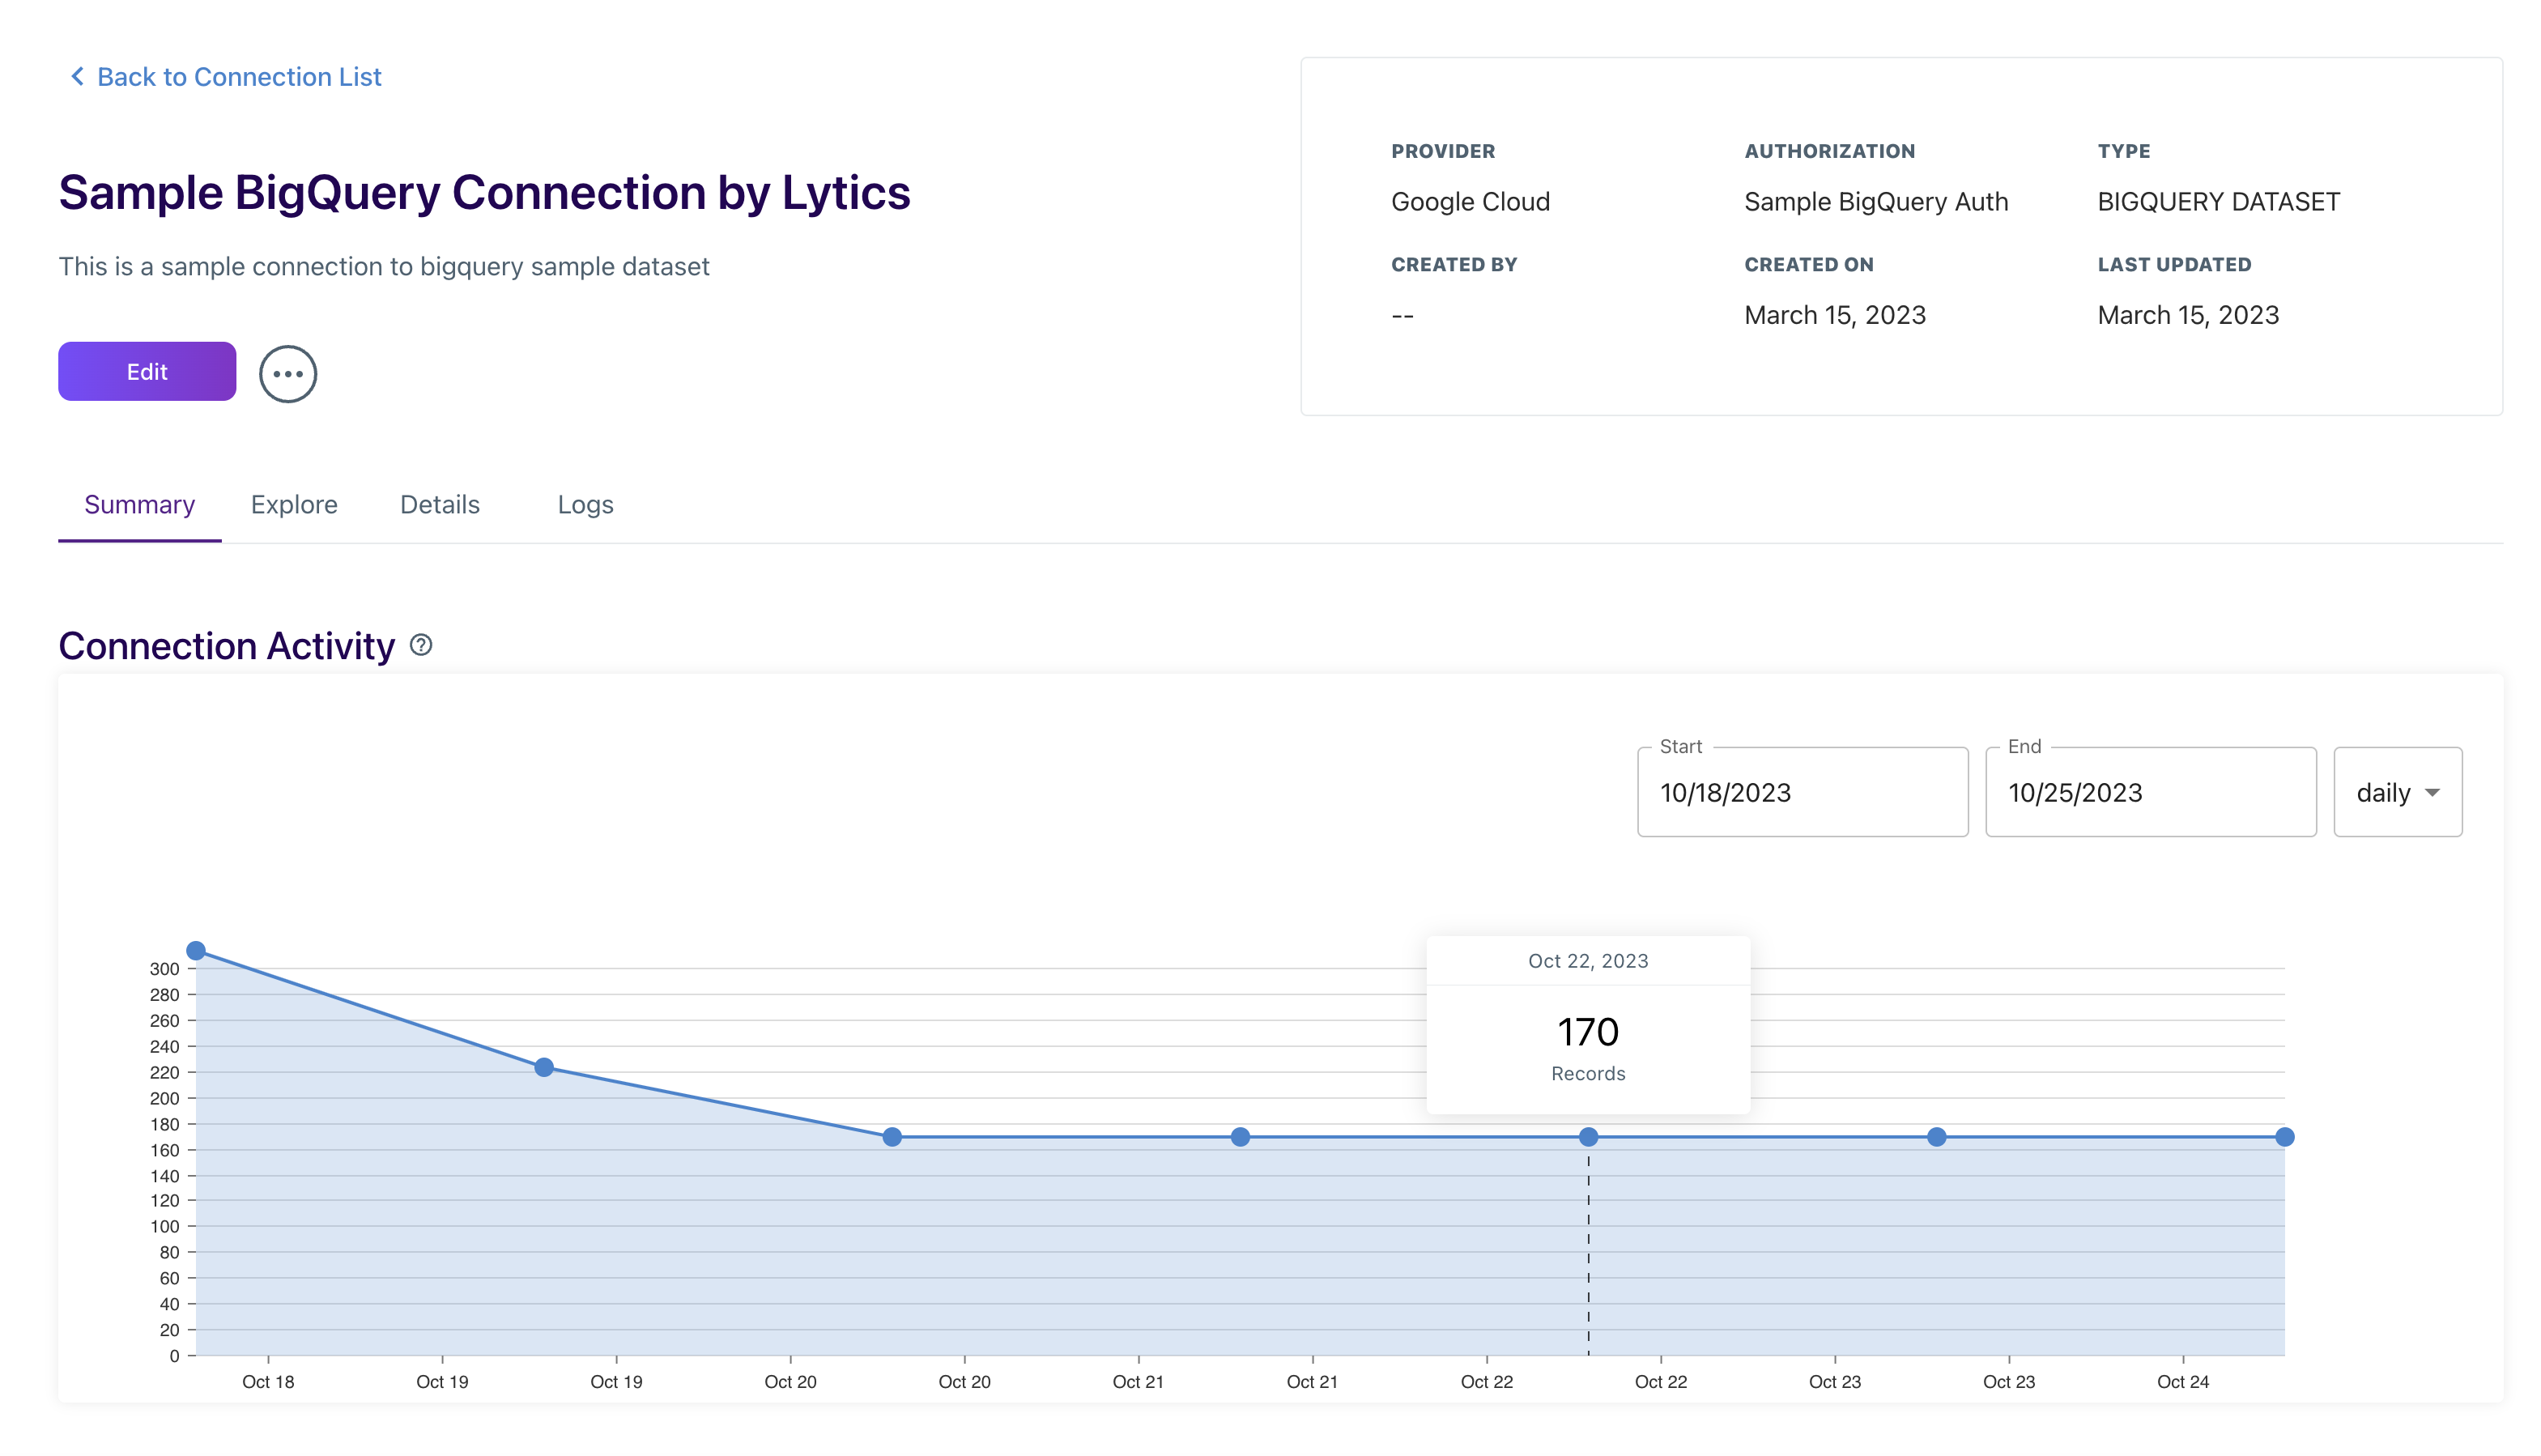
The rest of the Summary tab shows how many active and inactive data models are built using this Connection as a data source and how many tables are accessible from this dataset. The Activity chart displays how many rows are being queried, which can have cost implications based on your data warehouse usage.
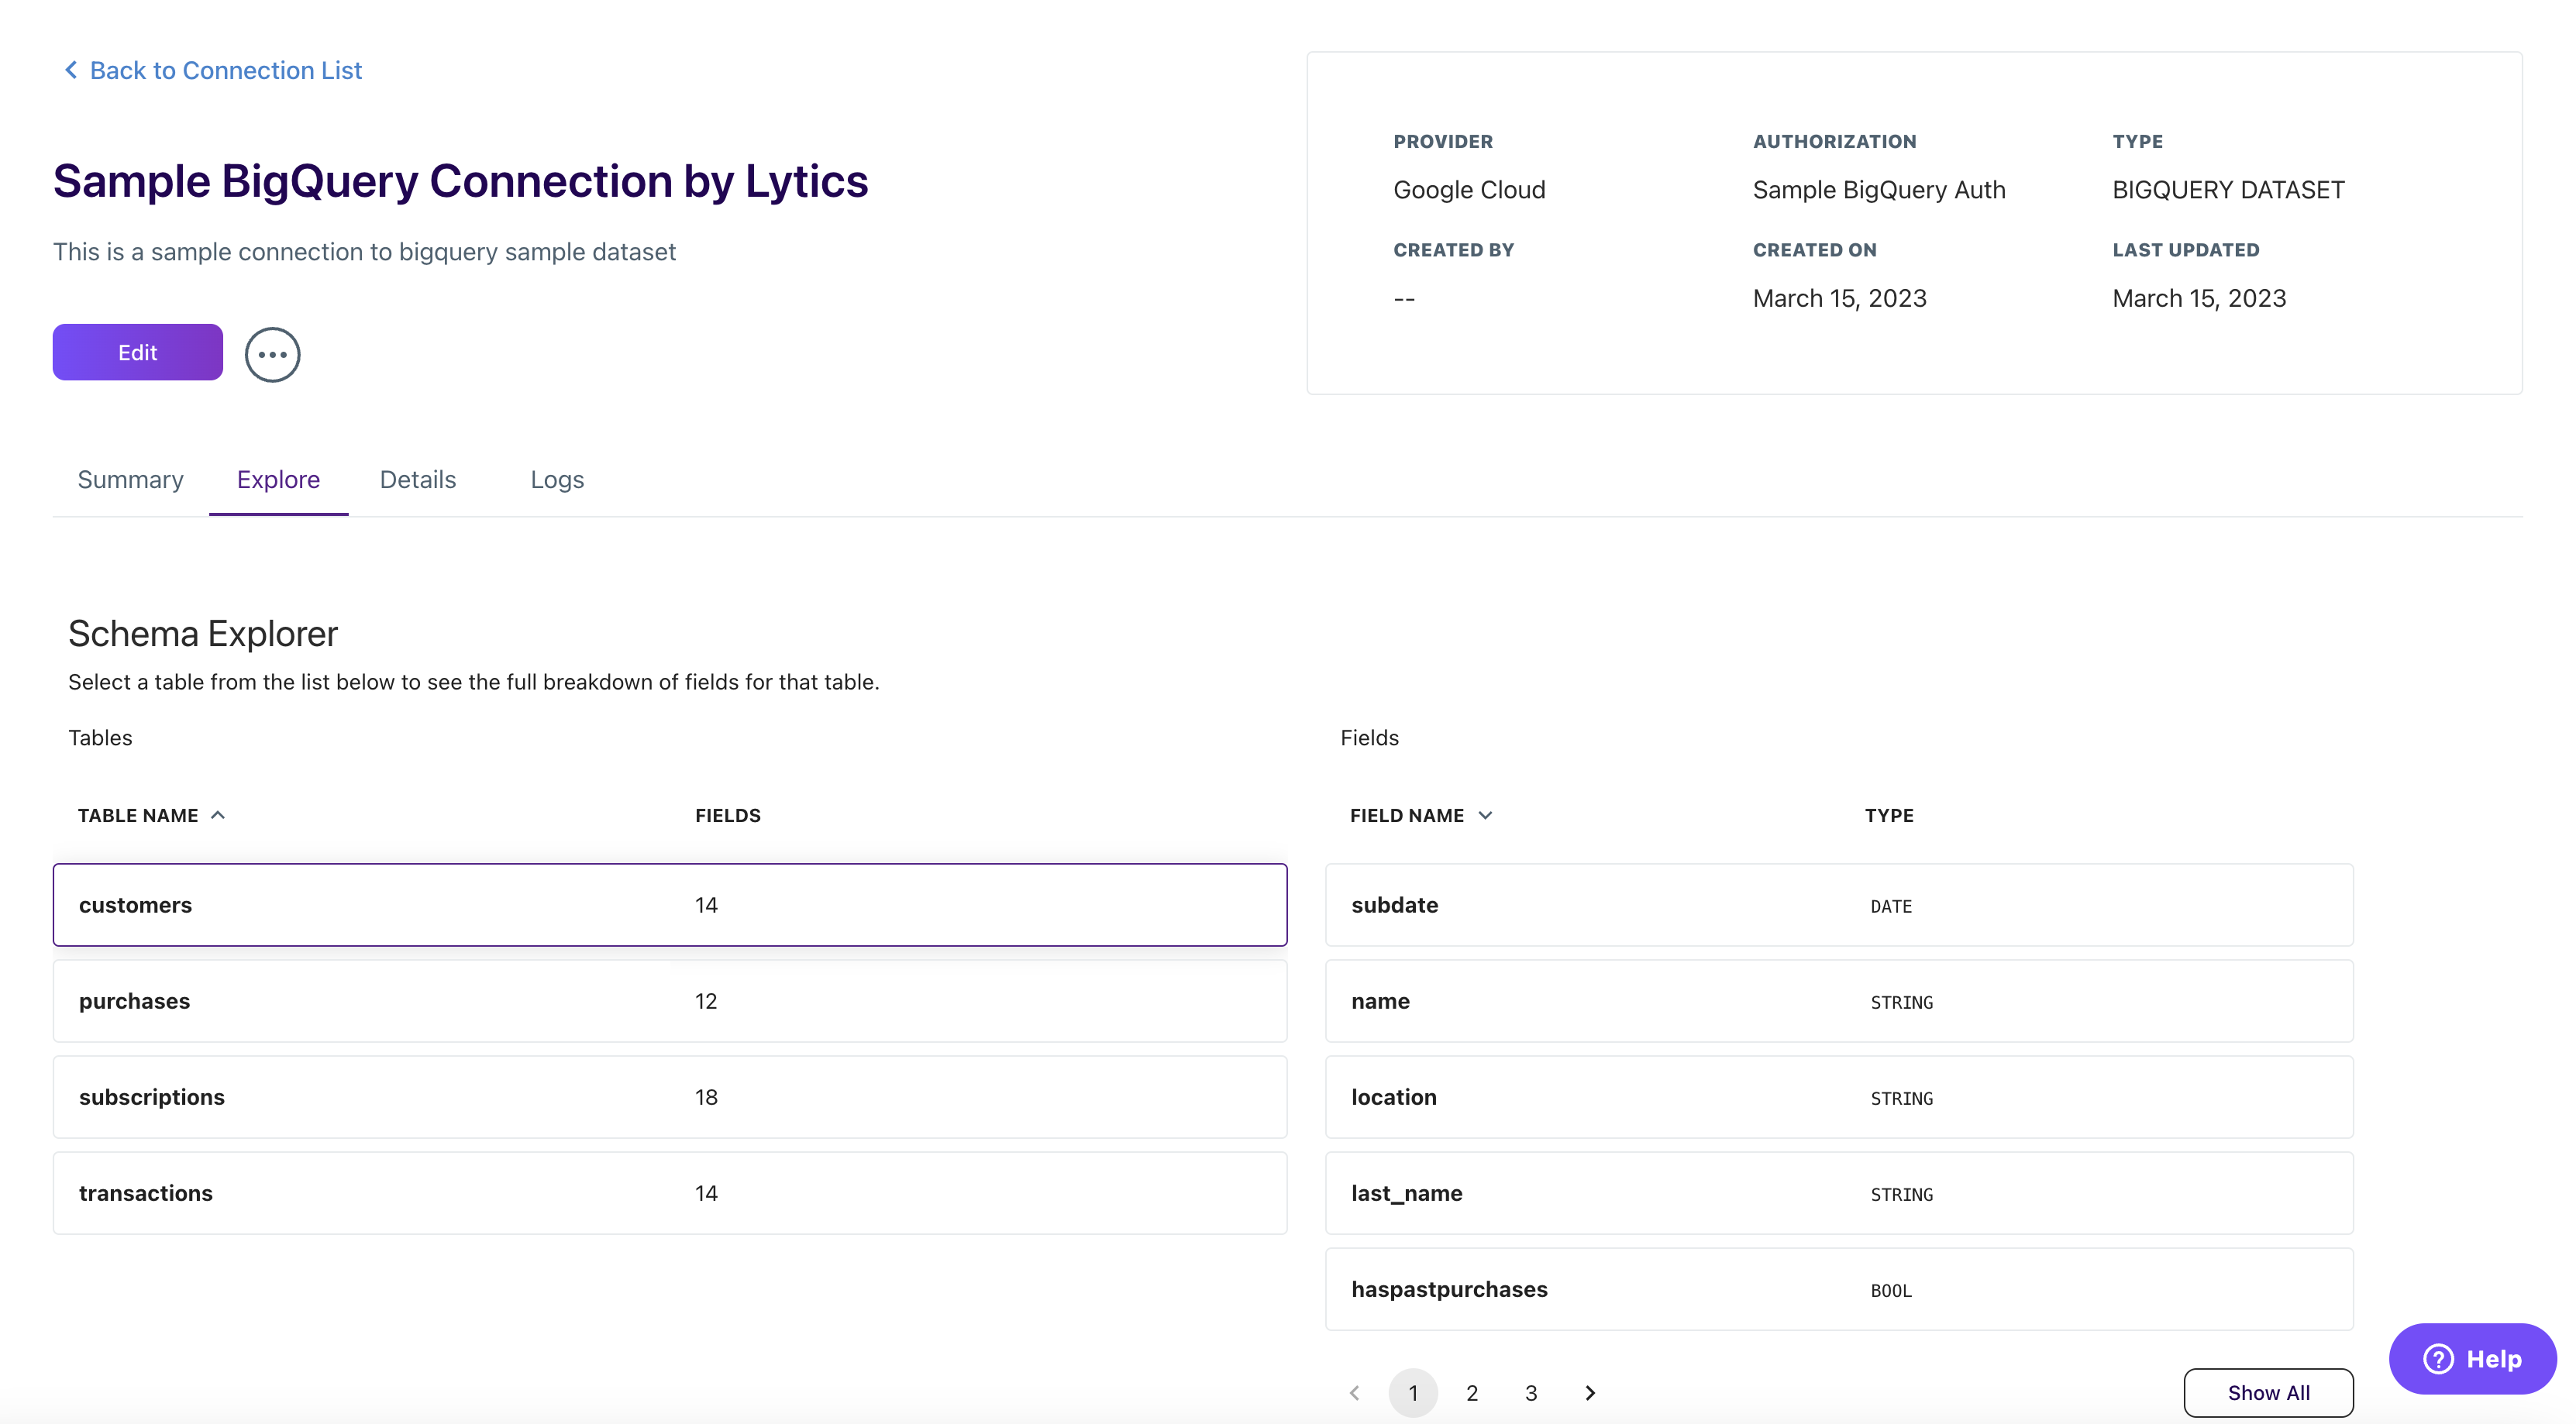
Explore
The Explore tab provides a simple Schema Explorer to validate that the data shown is as you would expect to see in your data warehouse. In the example below, we only connected an individual table, but here you will see as many tables as the authorization has read access to.
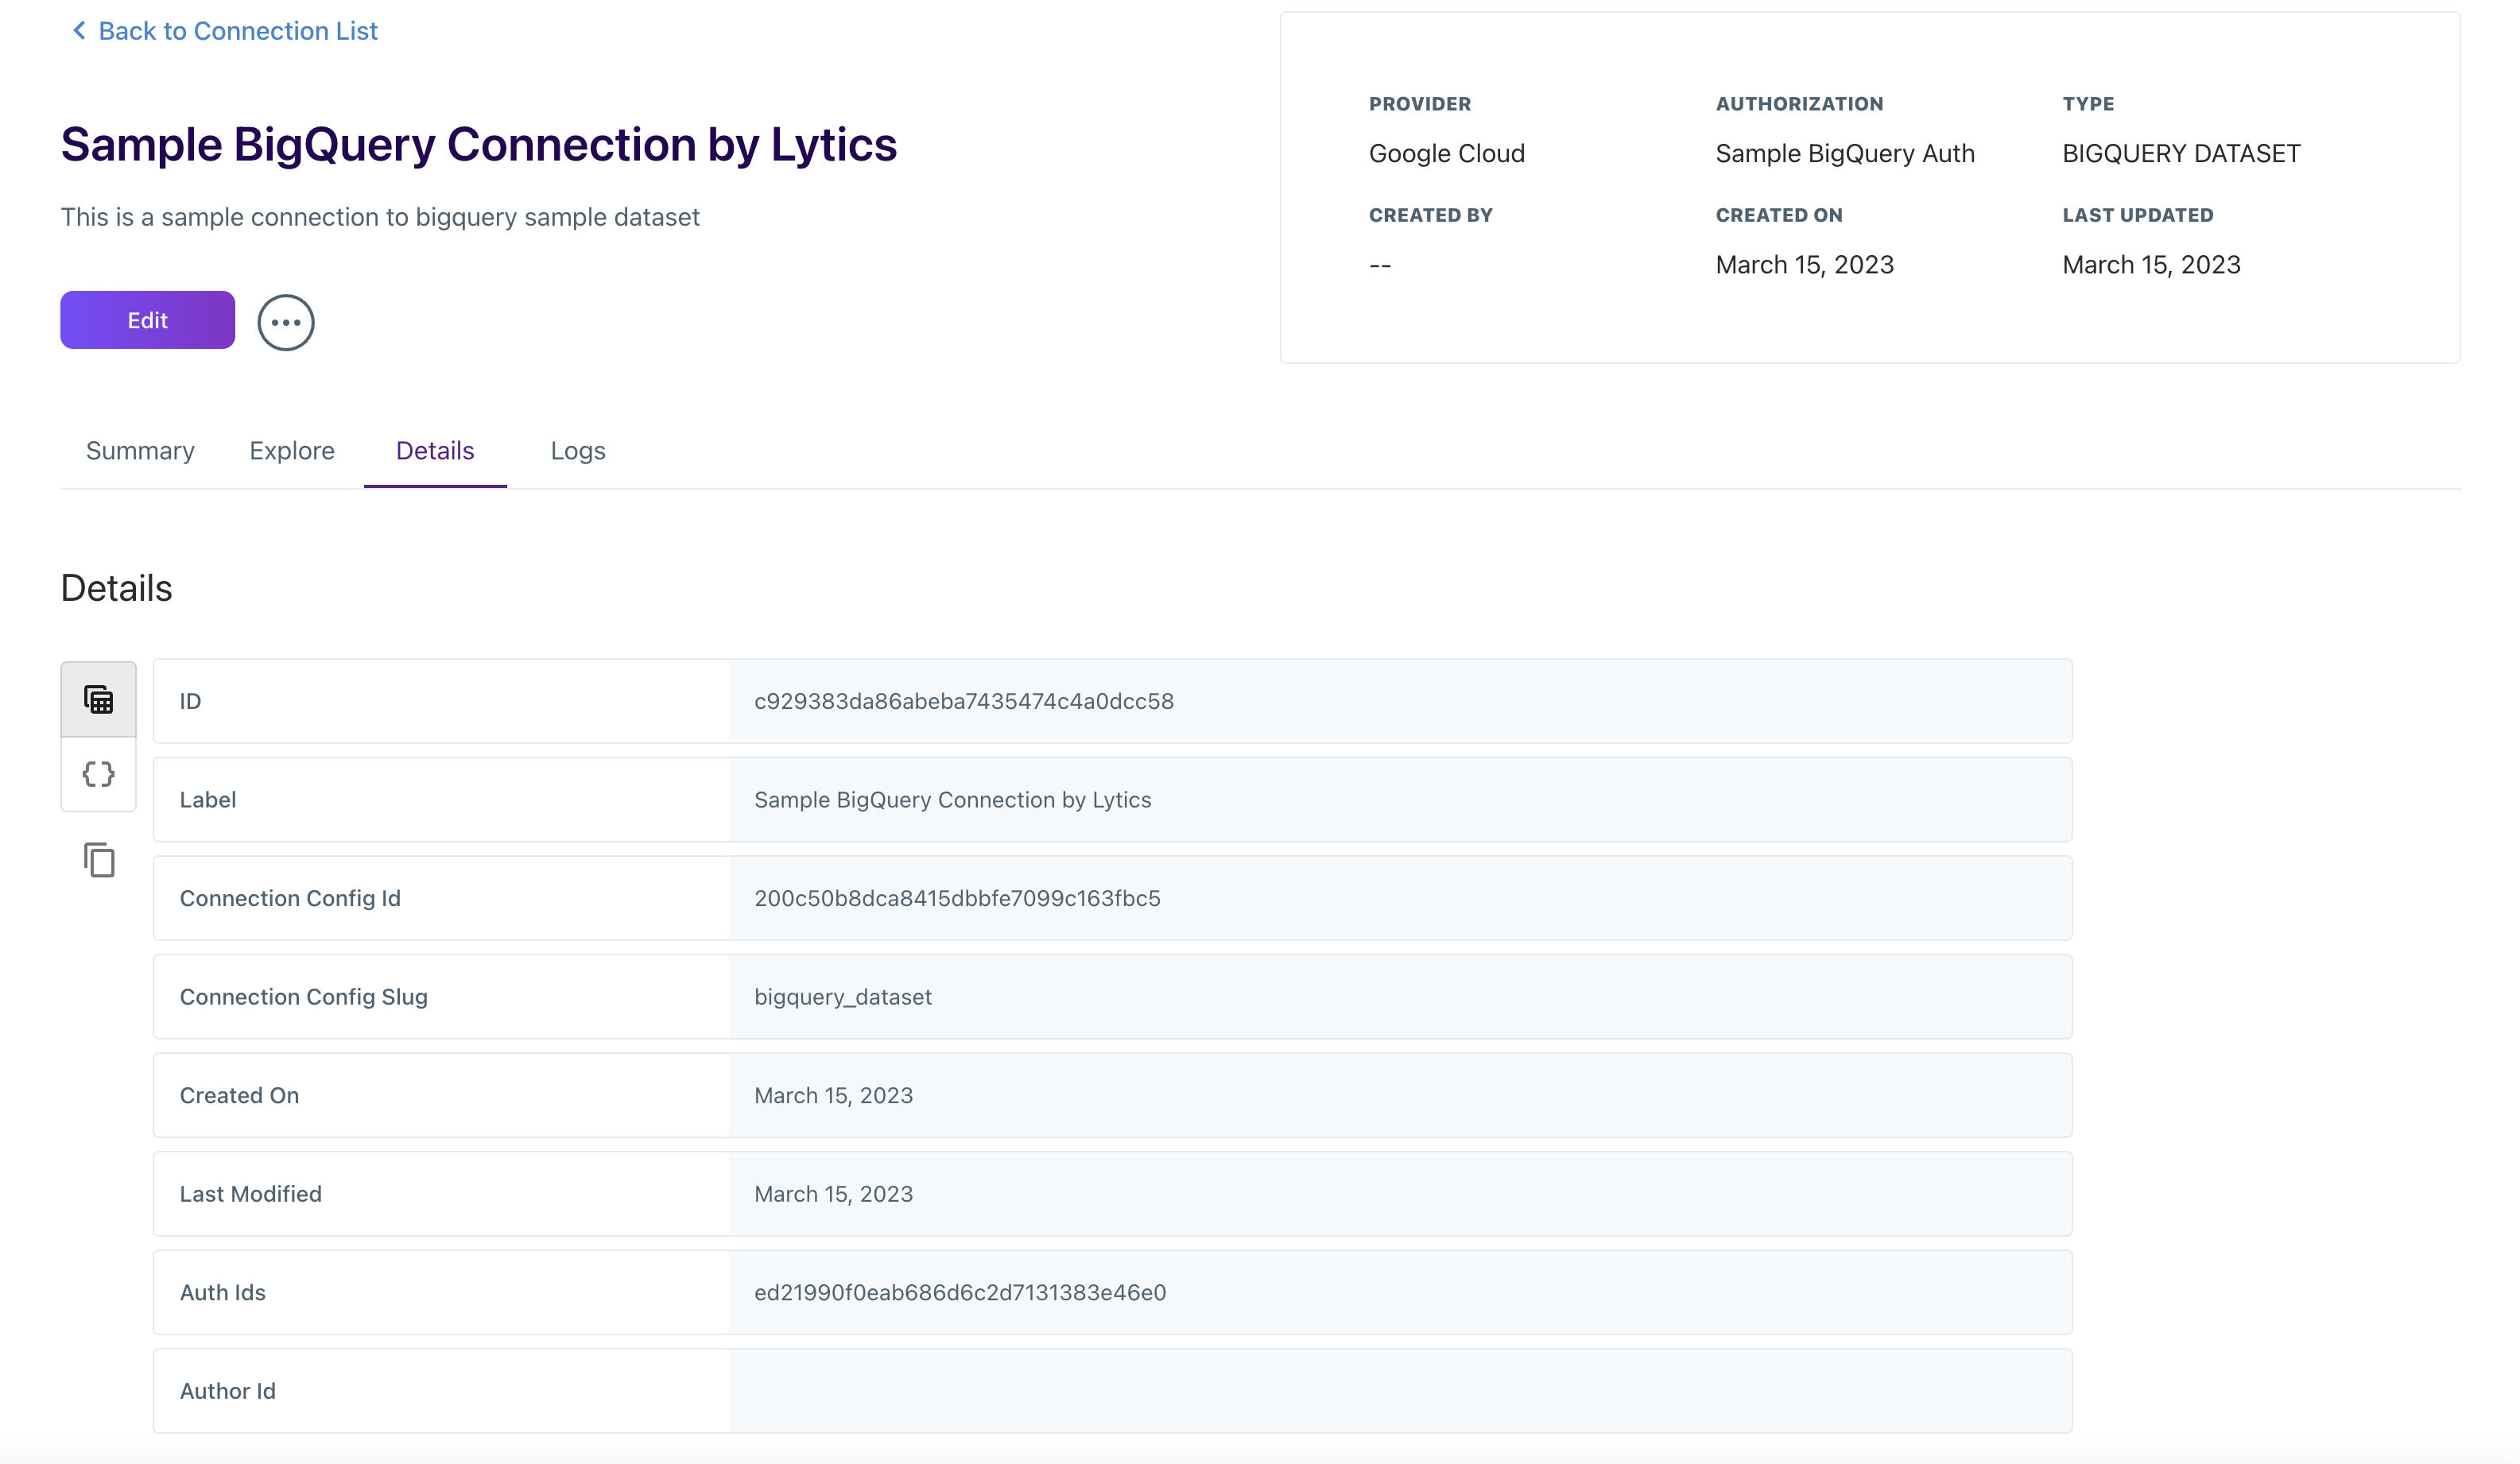
Details
The Details section displays all the information about setting up your Connection, including the authorization and configuration settings.
Logs
The Logs section records the history of events for this Connection, which are helpful to ensure your connection is working as expected. Below are the connection event types you may see.
| Connection Events | Description |
|---|---|
| Created | First event indicating the Connection is active. |
| Updated | Connection was updated by a Lytics user. |
| Deleted | Connection was removed and any data models built on this Connection will no longer be updated. |
Updated 10 months ago