

Google Cloud Operations
(Formerly Stackdriver)
Overview
Google Stackdriver is a monitoring service that collects logs, metrics, and traces across your applications and Google Cloud.
Integrating Lytics with Google Stackdriver allows you to export a variety of Lytics metrics to Google Stackdriver monitoring services so that you can easily set up dashboards, alerts, and thresholds inside your existing monitoring tool.
Authorization
If you haven't already done so, you will need to set up a Google Cloud Project before you begin the process described below. You will need "Editor" rights to your project to be able to ingest Lytics custome metrics.
If you are new to creating authorizations in Lytics, see the Authorizations documentation for more information.
- Select Google Cloud from the list of providers.
- Select the Stackdriver Metrics Service Account JWT method for authorization.
- Enter a Label to identify your authorization.
- (Optional) Enter a Description for further context on your authorization.
- In JSON Service Account JSON, enter your Google Service Account JSON Key. The instructions for collecting this JSON token are detailed beflow.
- Click Save Authorization.
Stackdriver Metrics Service Account JSON Key
During the configuration process for authorizations of type JSON key you will need to create a service account.
- In Google Cloud console under IAM & Admin select Service Accounts.
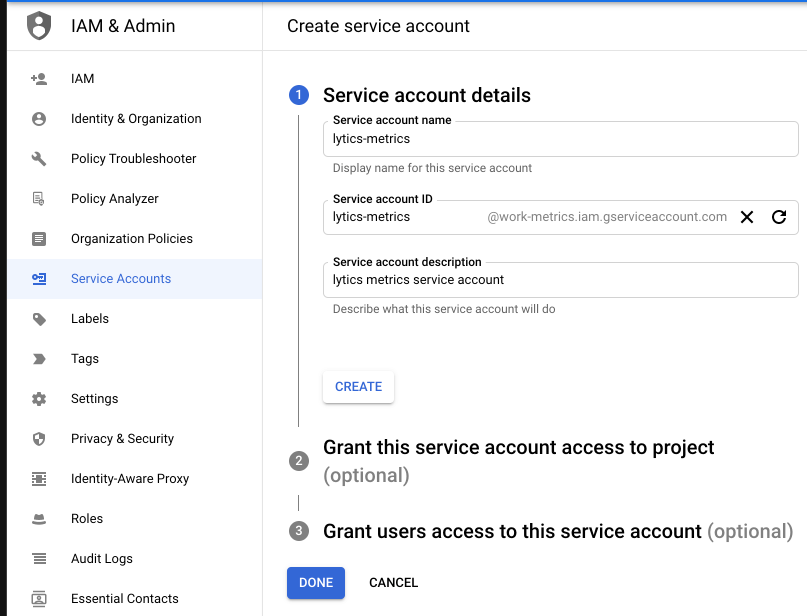
- Click + Create Service Account
- Enter the details for your new service account and click Create.
- From the Role dropdown menu, search for and select Monitoring Editor and click Continue to grant these account permissions.
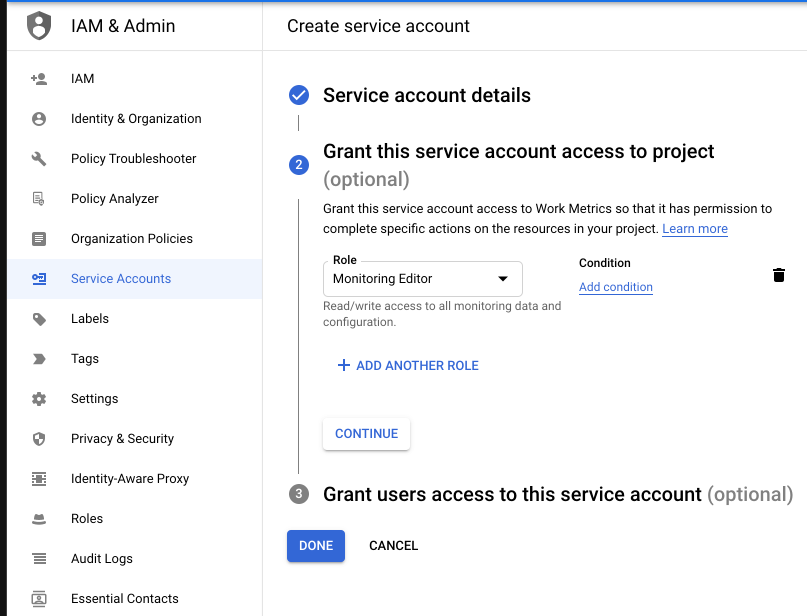
- Optionally grant users access to this service account.
- You will be directed back to the main Service Accounts page and you should now see your newly created service account.
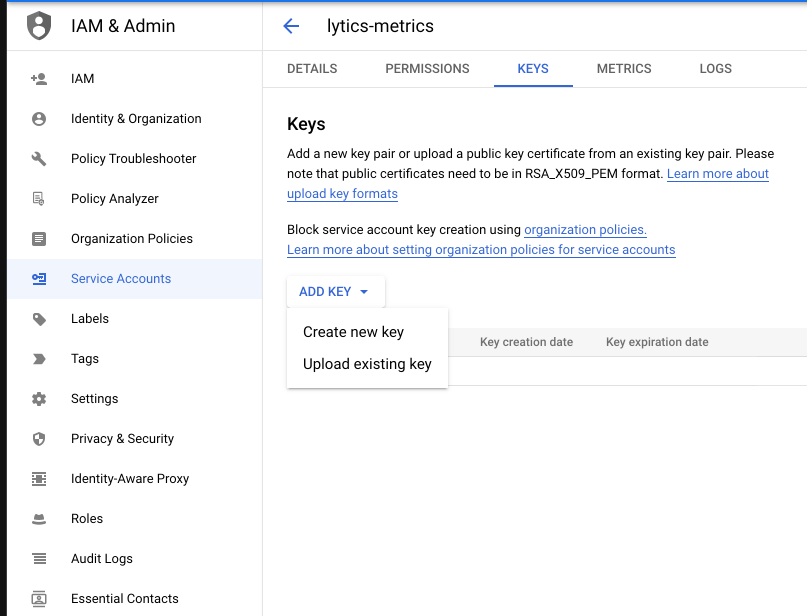
- Select this service account, click Keys tab, click Add Key, and select Create new key from the dropdown menu.
- Select JSON for key type and click Create to download your new key as a JSON file.
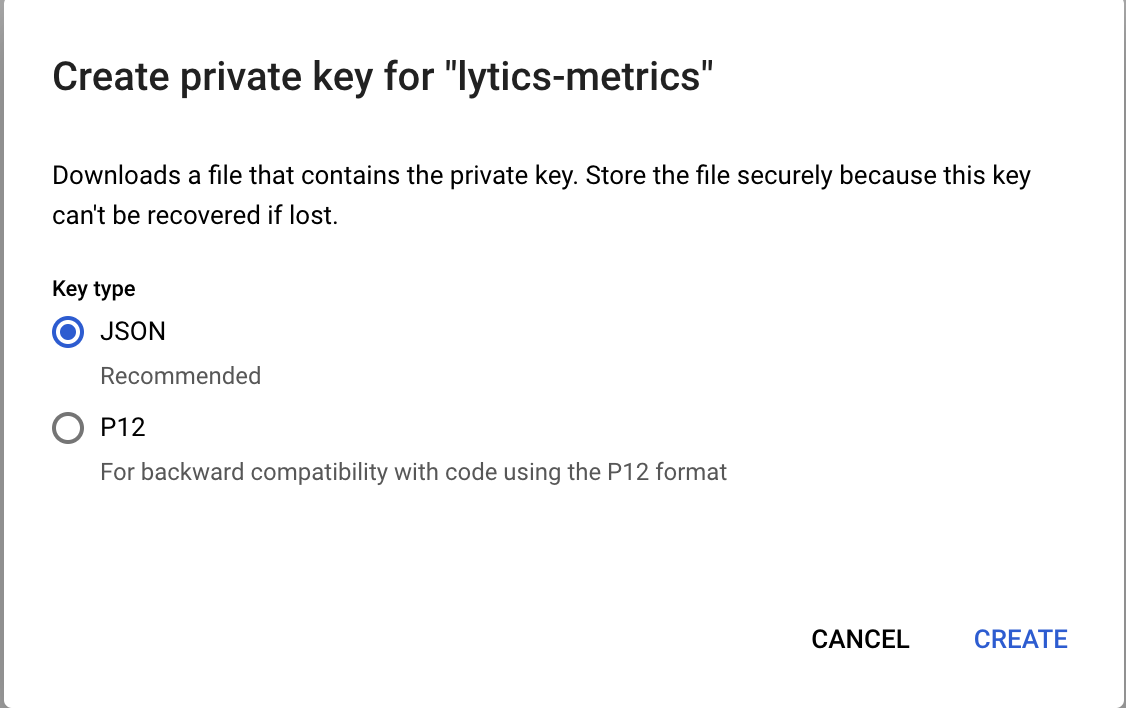
- The entire contents of this file represent your Google Service Account JSON key and will be used to authorize Google Stackdriver in Lytics.


Export Metrics
Export Lytics custom metrics to an existing Google Cloud project. These metrics include a monitoring heartbeat, an API heartbeat, collection count, and stream count. These metrics allow you to monitor, alert, and visualize important metrics from Lytics. Instead of building alerting into Lytics, Google Stackdriver Export Metrics allows metrics to be written into your own monitoring tool. These metrics can be used to:
- Allow alerting, oncall distribution lists, quiet-hours to be managed within a tool where you are already doing that for other metrics.
- Allow correlation of metrics you have (possibly website performance, etc) to be shown in context of other metrics.
- Prevent operational users from having to create a Lytics admin user-account.
Integration Details
- Implementation Type: Server-side Integration.
- Implementation Technique: REST API Integration
- Frequency: Metrics are written every 60 seconds.
- Resulting Data: Lytics custom metrics (monitoring heartbeat, API heartbeat, collection count, and stream count)
This integration utilizes the Google Cloud Monitoring Custom Metrics API to create and send Lytics custom metrics to your Google Stackdriver dashboards.
- Monitoring Heartbeat is a heartbeat of health of our metrics reporter
- API Heartbeat is a heartbeat of health of Lytics API
- Collection Count is a delta count of all events
- Stream Count is a delta count of all events per stream per hour. Stream Count is reported hourly.
Configuration
Follow these steps to set up an export job for Google Stackdriver. If you are new to creating jobs in Lytics, see the Destinations documentation for more information.
- Select Google Cloud from the list of providers.
- Select the Export Monitoring Metrics job type from the list.
- Select the Authorization you would like to use or create a new one.
- Enter a Label to identify this job you are creating in Lytics.
- (Optional) Enter a Description for further context on your job.
- Enter the Google Project you want to write metrics to.
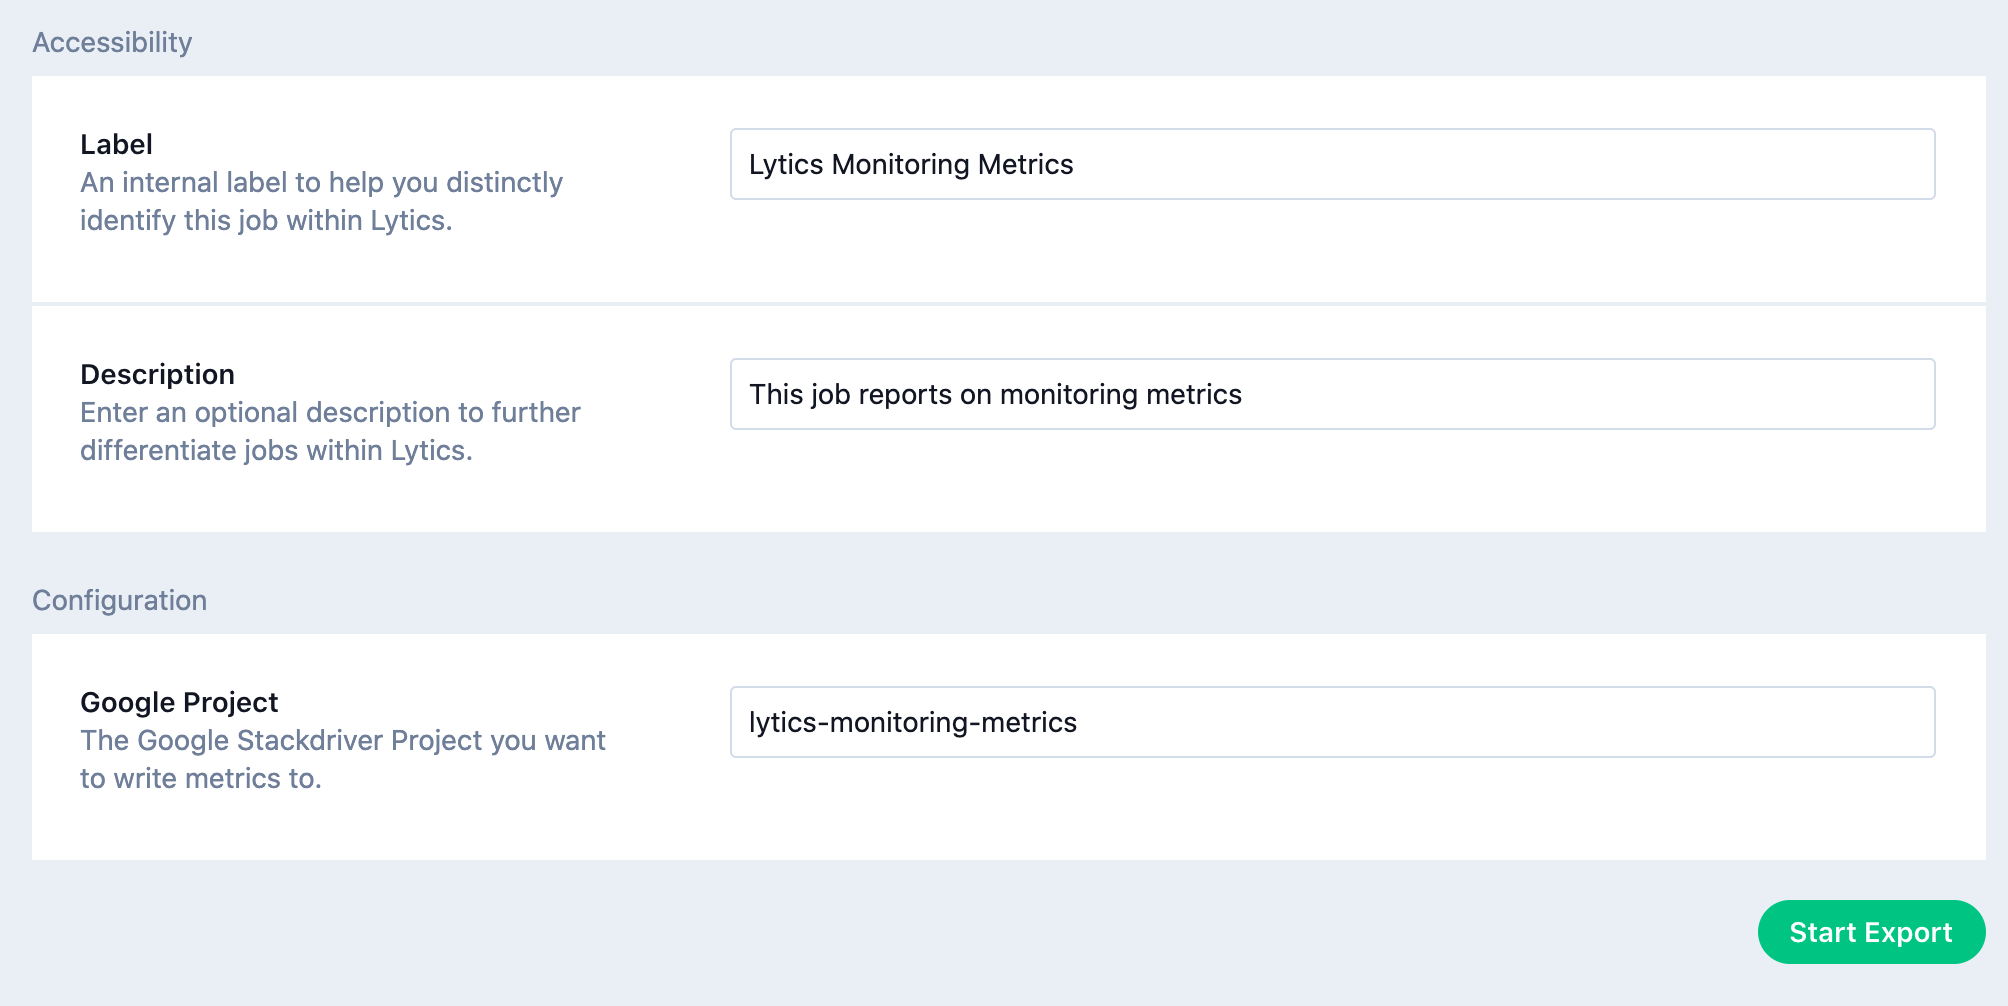
- Click Start Export.
Note: After the job has started, you will be able to find Lytics custom metrics in Google Cloud Monitoring. This may take up to 10 minutes. Once Monitoring Heartbeat metric is reported, then Lytics custom metrics are being received.


Using the Metrics
Once you have the metrics imported, you can now set up dashboards and alerting.
Updated 10 months ago