

Metric Threshold Alerts
Set min/max alert thresholds on audience, job, and stream activity charts.
Metric Threshold Alerts
Metrics rules let you set expected min and max bounds on Lytics activity charts and get notified by email when a metric falls outside those bounds. Lytics evaluates metrics rules hourly. When a violation occurs, users with the Metrics Rule Alerts role receive a batched email with links back to the affected charts.
Thresholds are available on four chart types:
- Audience size — on the Metrics tab of any audience.
- Job metrics — on the Metrics tab of any import or export job (Added, Removed, Omitted).
- Stream events — on the Event Activity chart for any data stream.
- Data Model records — on the Summary tab of any v2 Cloud Connect Data Model.
The configuration UI is identical across all four.
Configuring a threshold
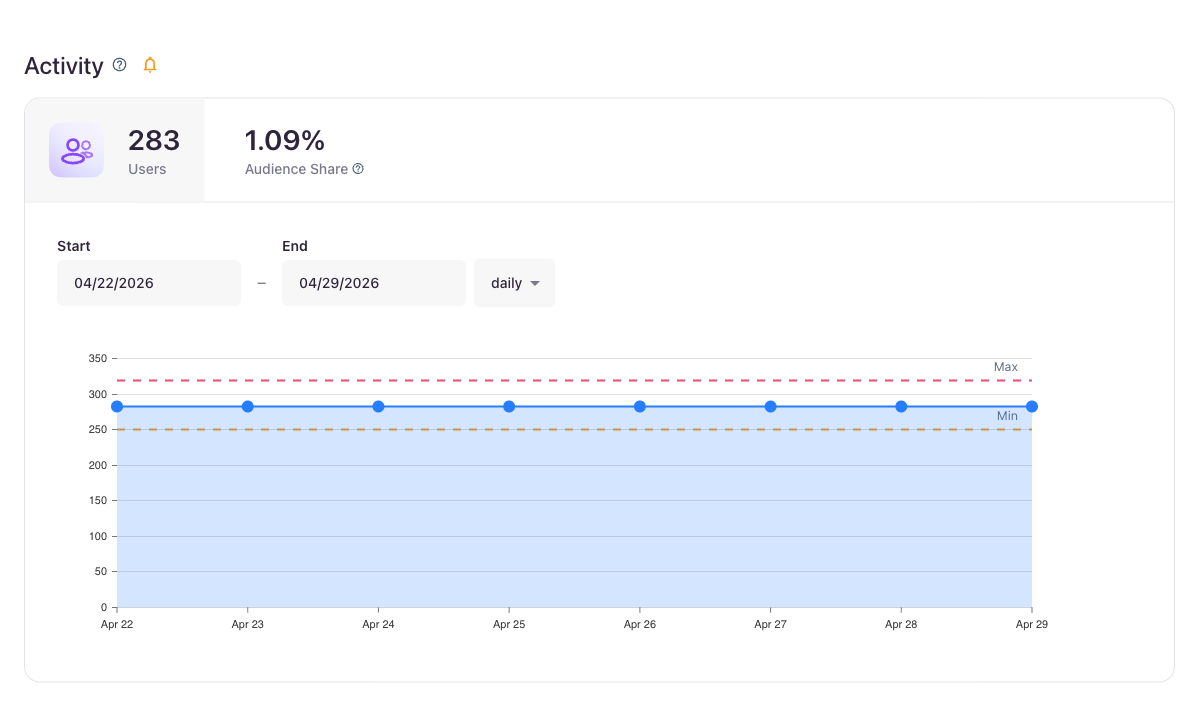
Each chart that supports thresholds shows a small bell icon next to the chart title. The bell is grey when no threshold is set and turns yellow once values are saved.
Click the bell to open the Alert Thresholds popover, then fill in:
- Interval —
per hour,per day, orper week. Required when thresholds are set. Lytics evaluates the metric in buckets of this size. - Min — the lower bound. Plotted as an orange dashed line on the chart.
- Max — the upper bound. Plotted as a red dashed line.
- Allowable violations — how many evaluation buckets are allowed to fall outside the bounds before the rule is considered violated.
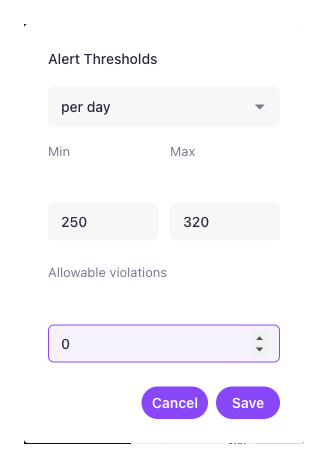
Click Save to apply. Click Clear in the popover to remove the metrics rule entirely.
Once saved, the threshold lines appear on the chart and the bell turns yellow:
Interval mismatchIf the chart is currently displaying a different interval than the one your metrics rule uses (for example, the rule is per day but the chart is set to hourly), the bell turns grey and a tooltip explains the mismatch. Switch the chart interval to match — or edit the rule — to see the threshold lines.
Where thresholds appear
Audience size
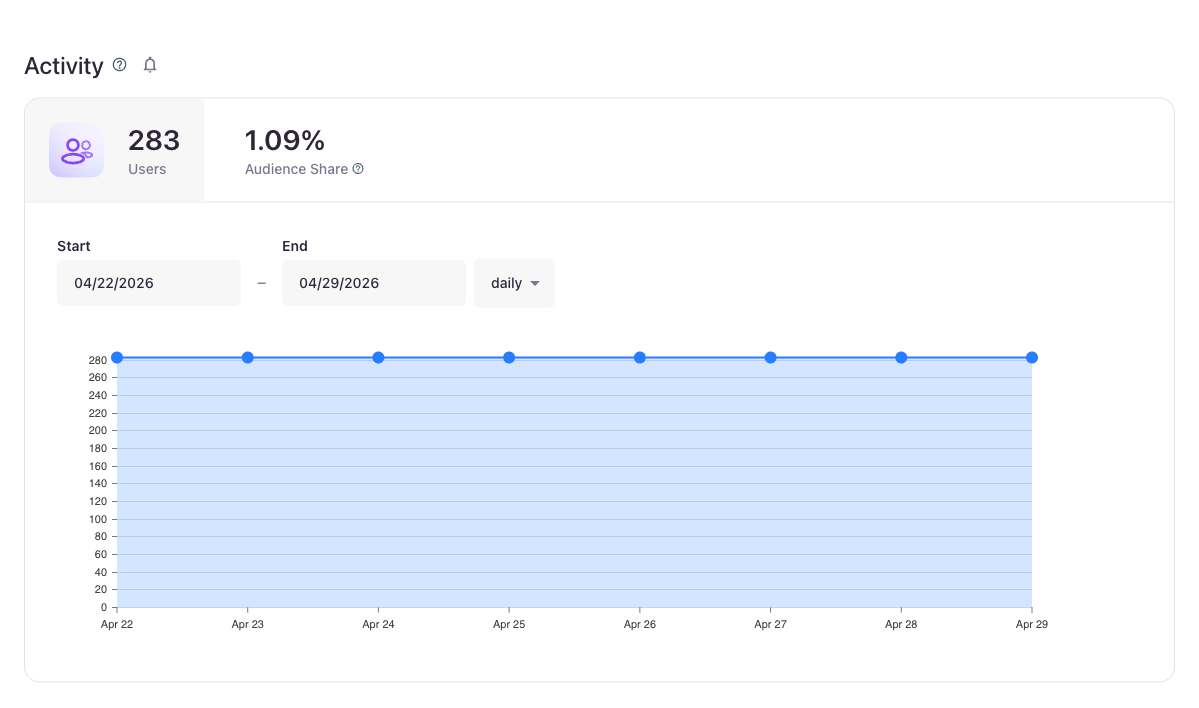
Open any audience and stay on the default Metrics tab. The bell sits next to the Activity title. The threshold applies to the audience's user count over time.
Job metrics
Open any import or export job (see Monitoring a Job). On the Metrics tab, the bell sits next to the Metrics title. The threshold applies to whichever sub-tab is active — Added, Removed, or Omitted — so you can alert on each independently.
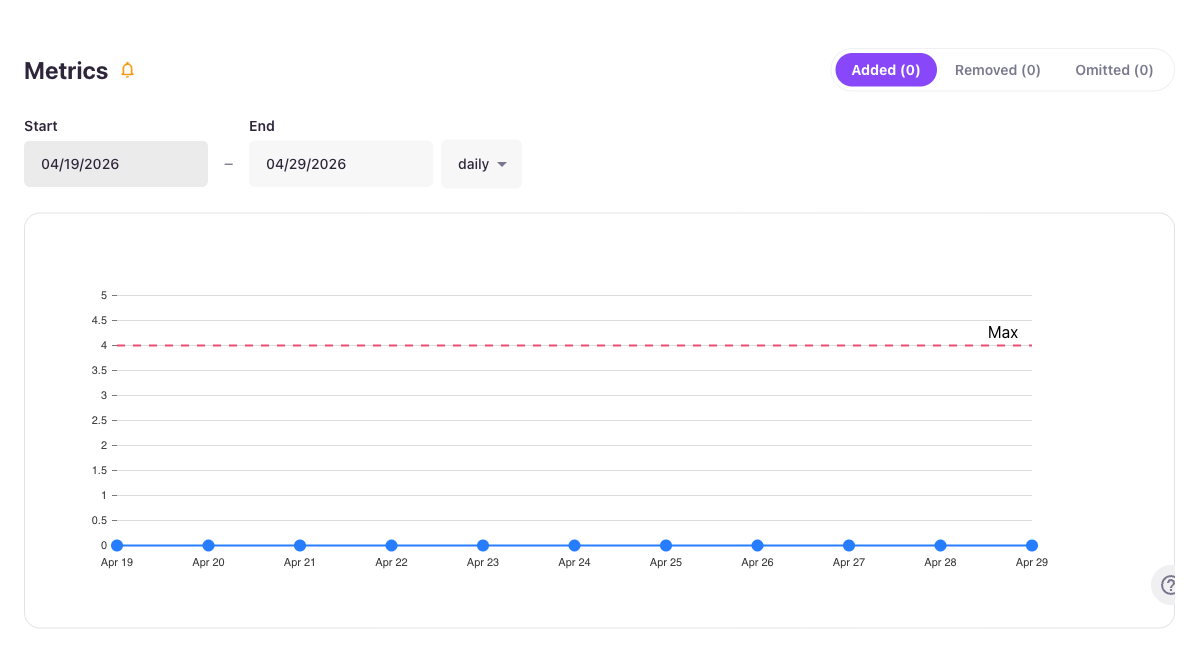
Default chart rangeThe Job Metrics chart now defaults to 10 days / daily, matching the daily metrics-check interval so threshold lines render on first open. Use the date range and interval controls to drill in further.
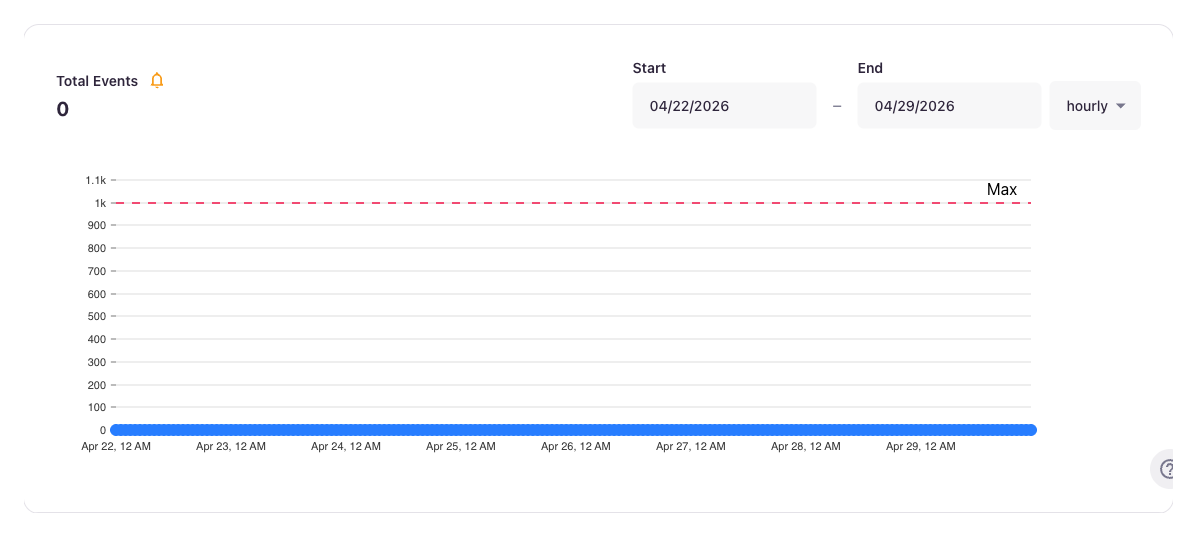
Stream events
Open Data Pipeline → Streams and select a data stream. The bell sits next to Total Events in the Event Activity card. The threshold applies to the stream's event volume.
Data Model records
Open Cloud Connect → Data Models and select a Cloud Connect Data Model. On the Summary tab, the bell sits next to Records for Data Model. The threshold applies to the record count returned by the model's SQL query over time.
v2 Data Models onlyThe bell icon appears only on v2 Cloud Connect Data Models. If you don't see it on a model that otherwise matches your permissions, the model is still on v1 — re-create it to opt into v2.
Email alerts
Once a metrics rule is saved, Lytics evaluates it on an hourly cycle. When the metric falls outside the configured bounds — exceeding the Allowable violations count — Lytics sends a batched alert email containing the account name, the violated metric, and a link back to the chart.
- Recipients — anyone in your account with the Metrics Rule Alerts role. Account administrators manage this role under Account → Roles.
- Throttle — duplicate emails for the same rule are suppressed within a 24-hour window, so a metric that stays out of bounds won't generate hourly noise.
- System events — every violation also emits an edge event into the system events stream, useful if you want to forward the signal into a downstream pipeline.
The Lytics Metrics Rule Detection workflow is auto-enabled for all accounts; there's no separate job to configure. If your account also uses Lytics Monitoring for job/quota email alerts, those continue to run independently — metrics rules cover metric-bound violations, Lytics Monitoring covers job/quota events.
Roles and permissions
| Role | What it controls |
|---|---|
| Metrics Rule View | See existing threshold lines and the bell icon |
| Metrics Rule Manage | Open the popover, save new rules, and clear thresholds |
| Metrics Rule Alerts | Receive threshold-violation emails |
Users without Metrics Rule View won't see the bell at all. Users with view but not Metrics Rule Manage will see existing threshold lines, but the popover controls will be disabled. Receiving emails is a separate role from managing rules — a user can have one without the other. Contact your account administrator to adjust role assignments.
Programmatic access
Metrics rules are persisted under the /v2/anomaly/rule API endpoint (the URL retains the original anomaly path for backward compatibility), scoped to the chart's underlying entity (audience, job, or stream). If you manage rules at scale, create, update, and delete them via the API instead of the UI — the same rules drive the chart lines and the email alerts.
Updated 2 months ago